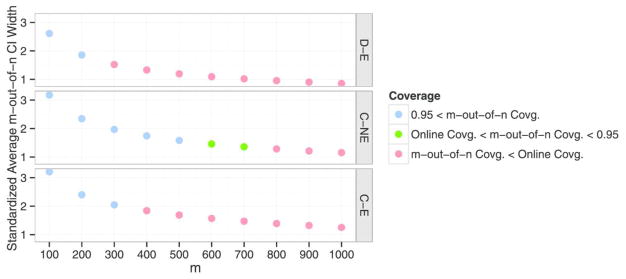
Fig. 3.
Performance of the m-out-of-n bootstrap at sample size 1000. The vertical axis shows the average CI width divided by the average CI width of the online one-step CI. That is, any vertical axis value above 1 indicates the m-out-of-n bootstrap has on average wider CIs than the online one-step CI.

