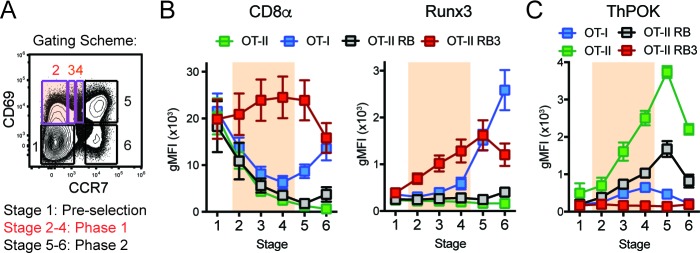
Figure 2. Acceleration of CD8-lineage commitment in HDAC3-deficient thymocytes.
(A) Gating scheme outlining two phases of CD4/CD8-lineage commitment—Phase one includes CD69+ CCR7- cells (Stage 2), CD69+ CCR7lo cells (Stage 3), and CD69+ CCR7int cells (Stage 4); Phase two identifies CD69+ CCR7+ cells (Stage 5) and CD69- CCR7+ cells (Stage 6). Orange shading highlights Phase 1. (B) Expression of Runx3 and CD8α during stages of lineage commitment (Stages 1–6), as outlined in (A) from OT-I, OT-II, OT-II RB and OT-II RB3 mice. CD69-versus-CCR7 plots were gated from DN-removed, CD45.2+ cells. (C) Expression of ThPOK during stages of lineage commitment, gated as in (B). Plots in B and C show mean ±SEM of MFI from 5 to 7 mice per group from five independent experiments.

