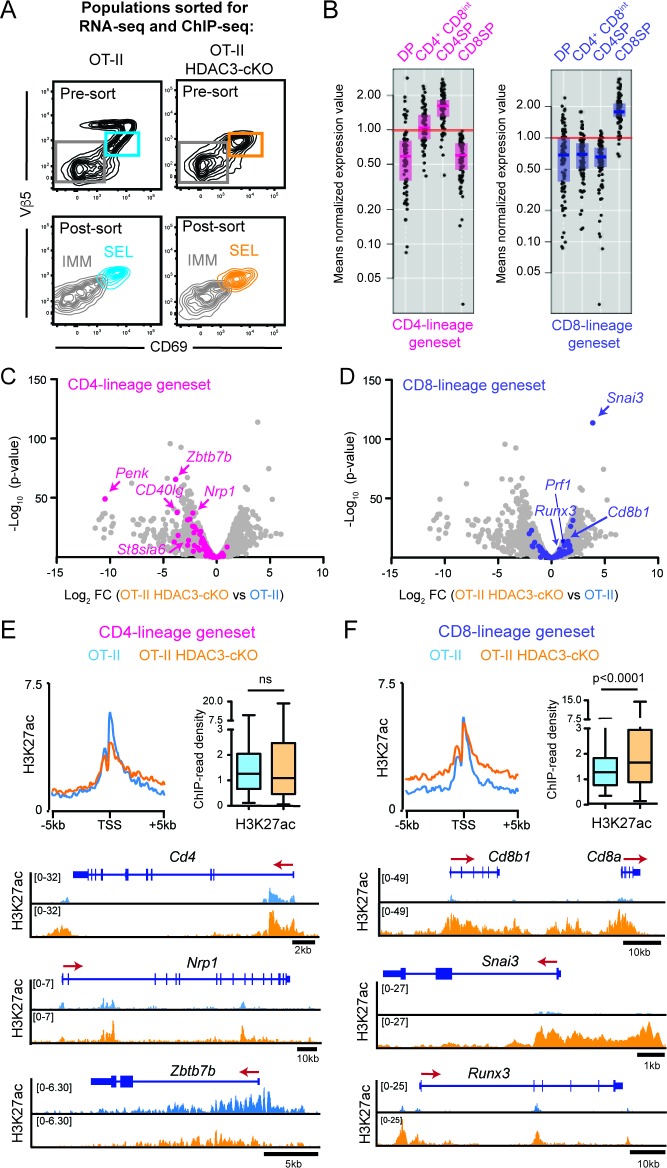
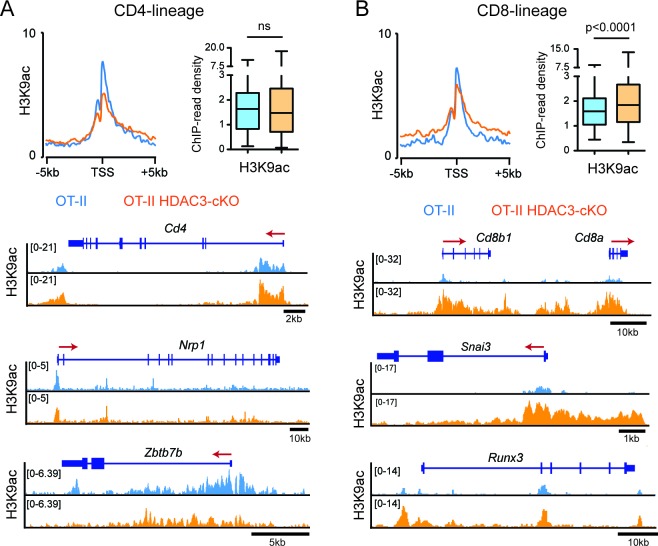
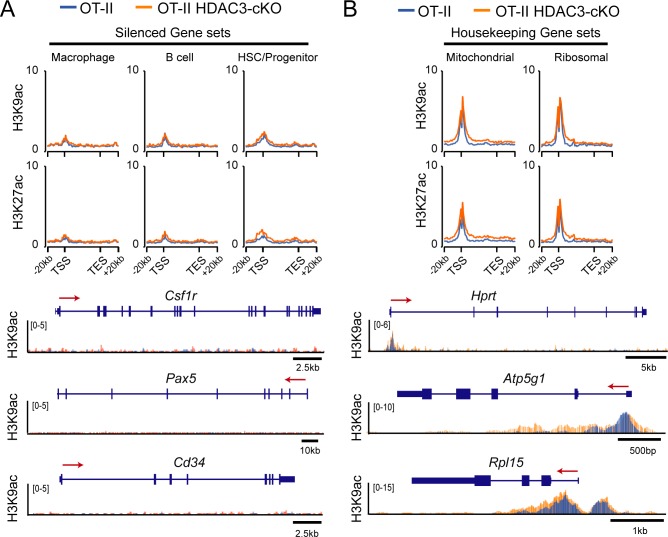
Figure 3. HDAC3-deficient thymocytes fail to induce the CD4-lineage program.
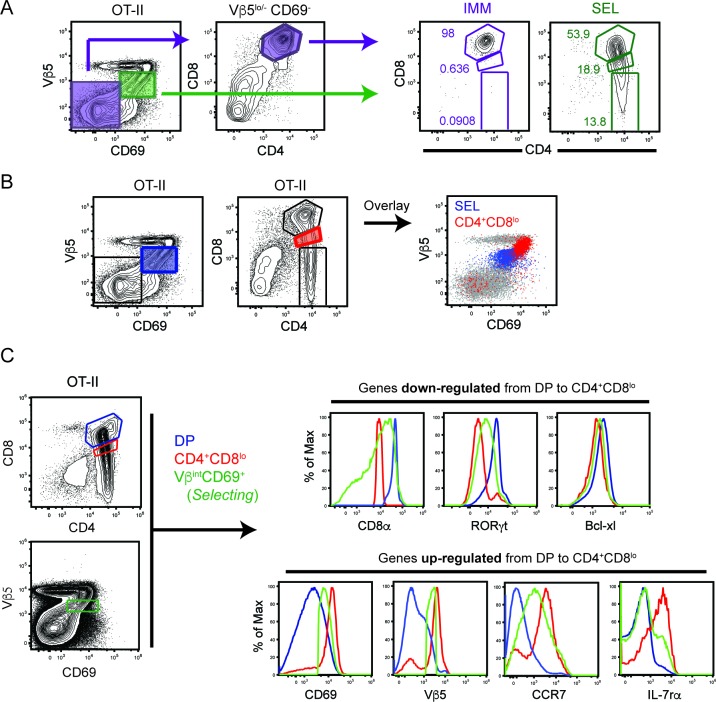
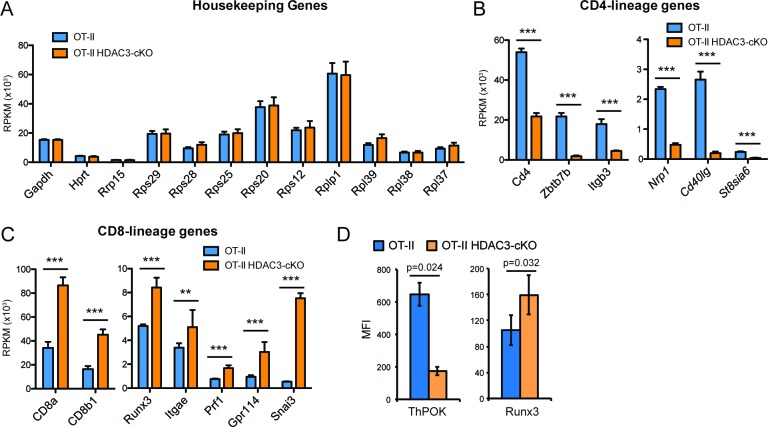
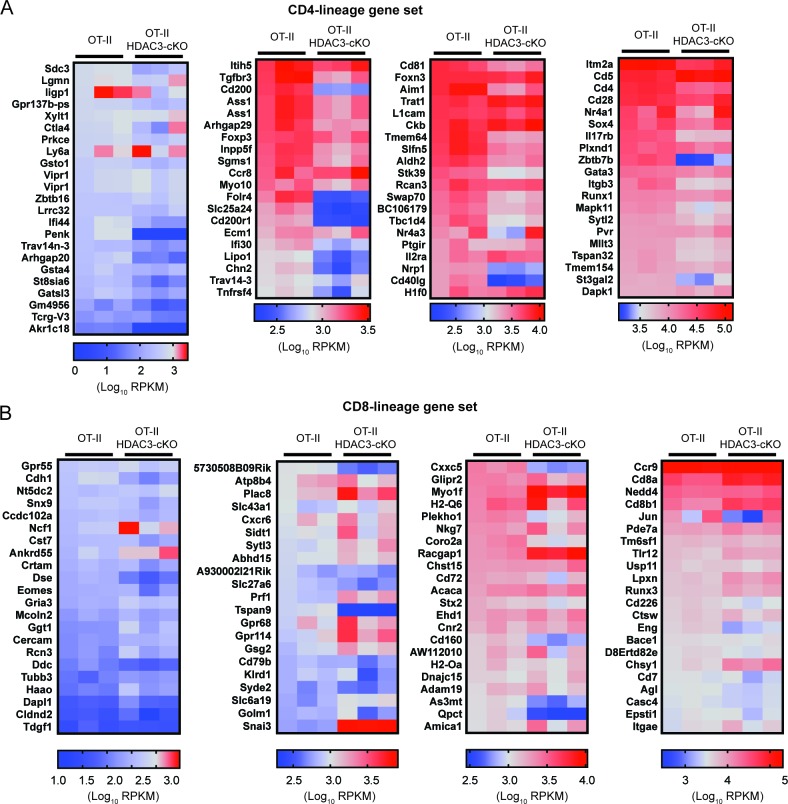
(A) Flow cytometric analysis of populations from OT-II and OT-II HDAC3-cKO mice sorted for RNA-seq and ChIP-seq. Plots show representative pre-sort and post-sort analysis of two FACS sorted populations—Immature thymocytes (Vβ5loCD69- CD4+CD8+) and Selecting thymocytes (Vβ5loCD69+). (B) Expression of CD4-lineage and CD8-lineage gene sets across DP, CD4+CD8lo, CD4SP, and CD8SP ImmGen expression data. (C–D) Volcano plot depicting the Log2fold change (FC) between OT-II HDAC3-cKO and OT-II Selecting (CD69+) cells. Grey dots show all genes; pink dots show CD4-lineage gene set (C); blue dots show CD8-lineage gene set (D). (E–F) Average H3K27ac ChIP-seq signal at the transcription start site (TSS) between OT-II and OT-II HDAC3-cKO Selecting (CD69+) cells for CD4-lineage gene sets (E) and CD8-lineage gene sets (F). Box-and-whisker plots depict H3K27ac signal at the TSS at CD4- or CD8-lineage genes between OT-II and OT-II HDAC3-cKO mice. Snapshots of example ChIP-seq tracks for each gene set are below. See also Figure 3—figure supplements 1–5 and Figure 3—source datas 1–2.

