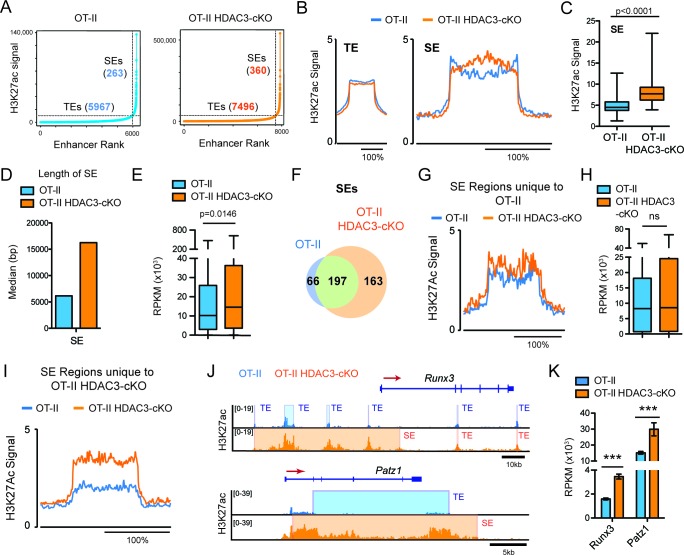
Figure 4. DP thymocytes from HDAC3-cKO mice show a CD8-lineage bias at the chromatin level.
(A) Typical enhancers (TEs) and super enhancers (SEs) in Immature (DP) cells from OT-II and OT-II HDAC3-cKO mice. (B) Average H3K27ac signal (normalized to input) for TE and SE regions from OT-II and OT-II HDAC3-cKO mice. (C) Box-and-whisker plot of H3K27ac signal for each super enhancer in OT-II and OT-II HDAC3-cKO mice. (D) Median length of super-enhancers between OT-II and OT-II HDAC3-cKO mice. (E) Box-and-whisker plots of mRNA expression (reads per kilobase of exon per million mapped reads, RPKM) from super-enhancer-associated genes from OT-II and OT-II HDAC3-cKO mice. (F) Venn Diagram of shared and unique SEs between OT-II and OT-II HDAC3-cKO mice. (G) H3K27ac signal at super-enhancer regions unique to OT-II mice and the corresponding regions in OT-II HDAC3-cKO mice. (H) Box-and-whisker plots of mRNA expression (RPKM) between OT-II and OT-II HDAC3-cKO mice of genes associated with super-enhancers unique to OT-II mice. (I) H3K27ac signal at super-enhancer regions unique to OT-II HDAC3-cKO mice and the corresponding regions in OT-II mice. (J) Snapshot of H3K27ac ChIP-seq tracks at the Runx3 and Patz1 locus from OT-II (blue) and OT-II HDAC3-cKO (orange) mice. Shaded regions depict TEs and SEs. (K) Gene expression (RNA-seq) of Runx3 and Patz1 in Immature (DP) cells from OT-II and OT-II HDAC3-cKO mice. (B, G, I) The x-axis represents a surrounding area that corresponds to 200% of the center of each region. (***, p < 0.001). See also Figure 4—source data 1.

