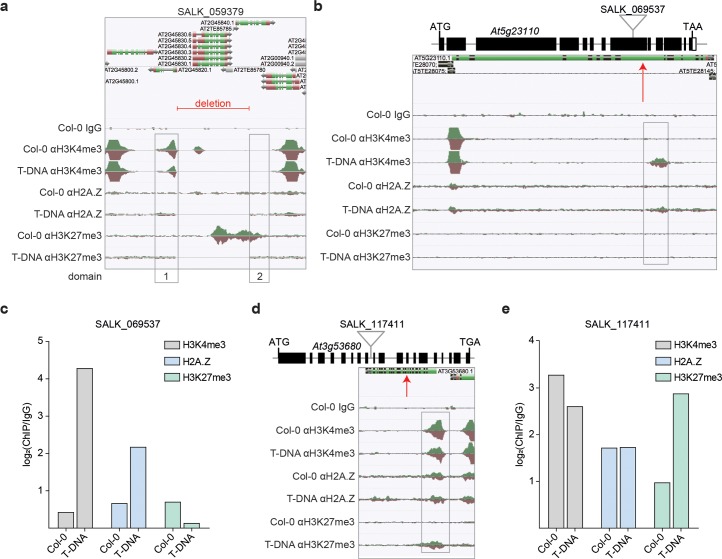
Fig 4. T-DNA insertions alter the chromatin landscape.
(a) AnnoJ genome browser visualization of ChIP-seq reads derived from H3K4me3, H2A.Z and H3K27me3 occupancy in Col-0 and SALK_059379 seedlings around the T-DNA-induced deletion on the chromosome 2. Histone domains that are adjacent to the T-DNA deletion are indicated as domain 1 and 2. (b) Annoj genome browser visualization of H3K4me3, H2A.Z and H3K27me3 occupancy in Col-0 and SALK_069537 seedlings around the T-DNA insertion at At5g23110. Schematic illustration shows the gene structure of At5g23110 and the approximate location of the corresponding T-DNA insertion. (c) Quantification of H3K4me3, H2A.Z and H3K27me3 around the T-DNA insertion site at At5g23110 (SALK_069537). (d) Visualization of H3K4me3, H2A.Z and H3K27me3 occupancy in Col-0 and SALK_117411 seedlings indicates de novo trimethylation of H3K27 around the T-DNA insertion in At3g53680. Scheme of gene structure of At3g53680 shows the approximate location of the T-DNA insertion into the genome of SALK_117411 plants. (b) Levels of H3K4me3, H2A.Z and H3K27me3 around the T-DNA insertion at At3g53680 in SALK_117411 seedlings are shown. A red arrow marks the approximate location of the T-DNA integration site in the Annoj genome browser screenshots. The respective occupancies were identified with ChIP-seq and all shown AnnoJ genome browser tracks were normalized to the respective sequencing depth. The Col-0 IgG track serves as a control. The occupancy of the respective domains was calculated as the ratio between the respective ChIP-seq sample and the Col-0 IgG control.

