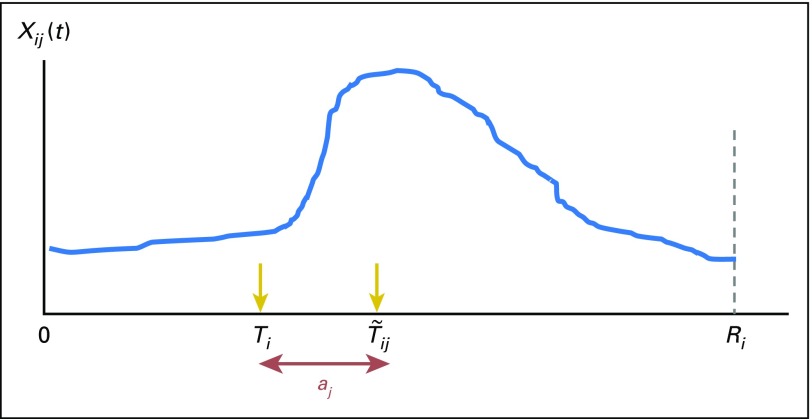
Fig 1.
Illustration of a typical pattern of the trajectory of indicators. Xij (t) = longitudinal profile of a potential indicator j for subject i (eg, the trajectory of the count of diagnosis codes for secondary malignant neoplasm). 0 = start of the observation period (eg, initial cancer diagnosis). Ri = end of the observation period for subject i (eg, end of observation/follow-up time). Ti = time of the event occurrence for subject i (eg, cancer recurs). = time when a large gap in Xij is observed (eg, the count of diagnosis codes for secondary malignant neoplasm per month increases more than a specified threshold compared with the previous months). aj = an unknown parameter that takes account of the potential difference between the event occurrence time Ti and the time when the observed gap in Xij is observed ().

