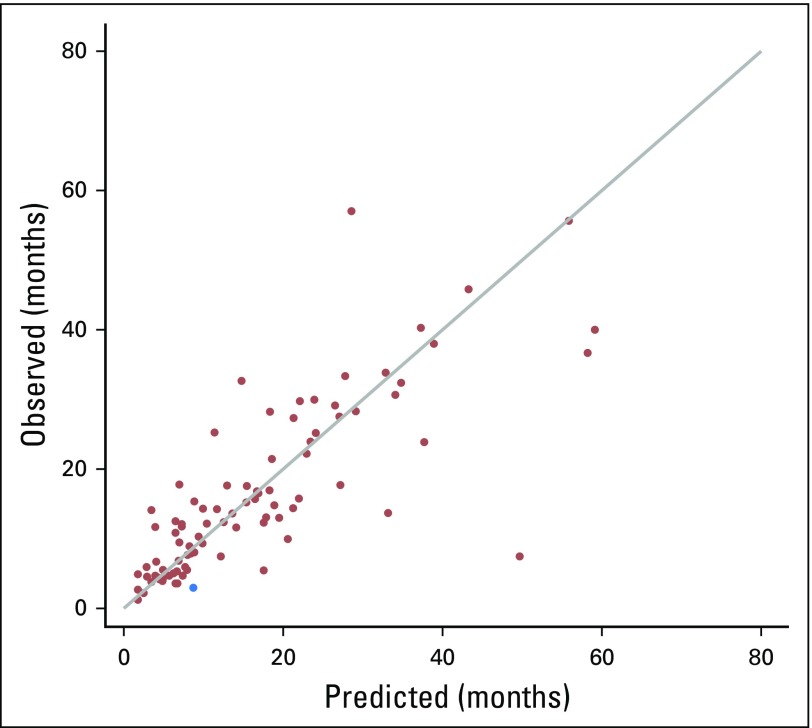
Fig 3.
Scatter plot between the predicted time of recurrence and the observed time of recurrence for the final model using Cancer Care Outcomes Research and Surveillance/Medicare data for patients with lung cancer, in months after definitive local therapy. Red dots indicate subjects for whom the indicator variable produced a predicted time of recurrence. The blue dot indicates the subject whose predicted time of recurrence was estimated by the naïve prediction rule (ie, Ri/2; the half time of the given time window).

