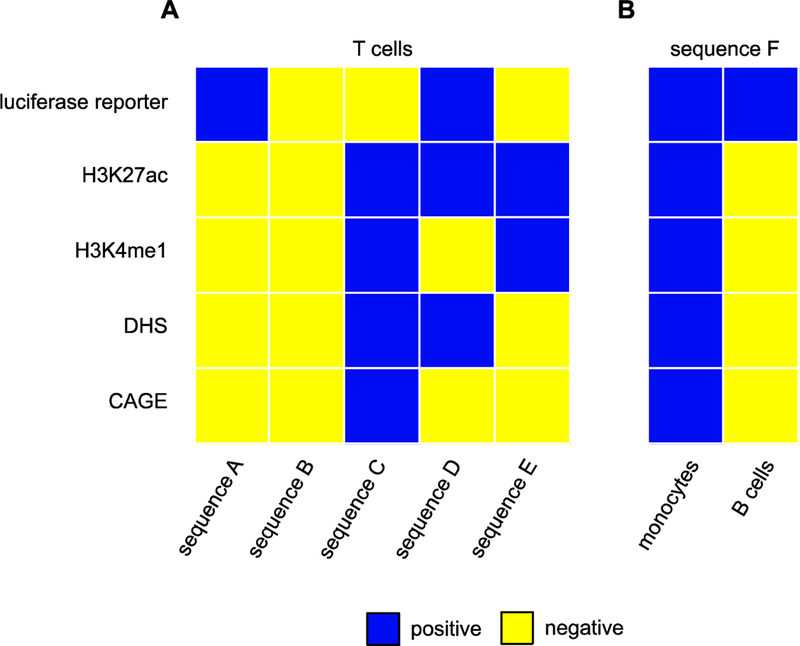
Figure 3: Enhancer “definitions” are not consistent.

Data from [36] illustrate how defining enhancers based on reporter gene activity, histone modifications, chromatin accessibility, and enhancer transcription provides inconsistent and/or contradictory results. (A) Five different sequences have a different pattern of possible enhancer characteristics when tested in a common cell type (T cells). Blue squares indicate a positive assay result, yellow negative. Each sequence was assessed for: its ability to drive a luciferase reporter gene; H3K27 acteylation; H3K4 monomethylation; chromatin accessibility in the form of DNAseI hypersensitive sites (DHS); and bidirectional transcription (CAGE). No clear trend emerges from the set of assays. (B) The identical sequence can drive reporter gene expression in two different cell lines, but in one cell type can be positive for a set of several possible enhancer characteristics whereas in the other it can be negative for the entire same set. [Data for this figure were adapted from Figure S17 of [36]; sequences A-F correspond to the eighth, ninth, twenty-eighth, first, thirteenth, and eighteenth columns, respectively.]
