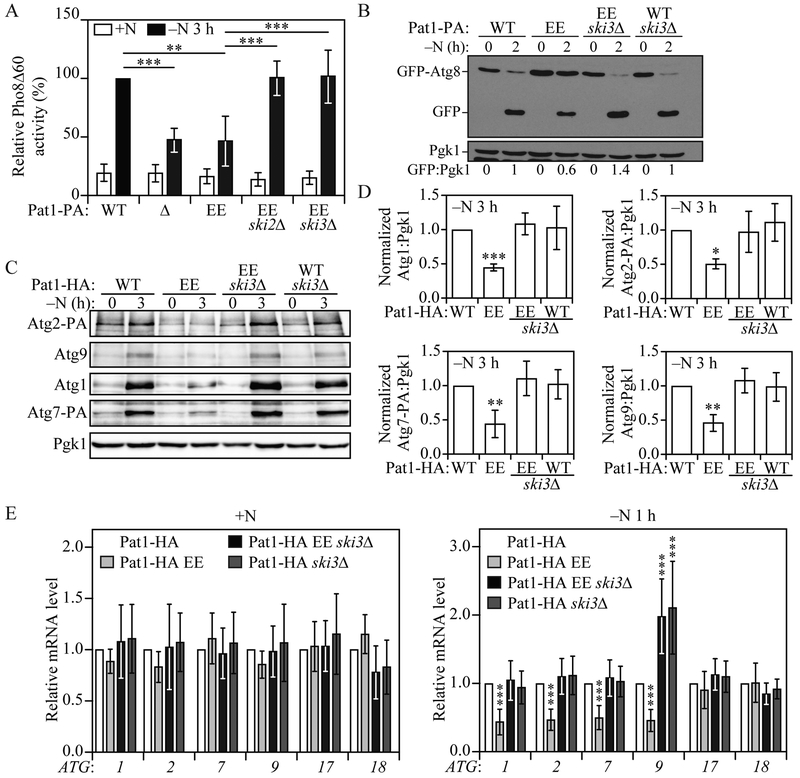
Fig. 5. SKI3 deletion prevents the Pat1S456E- and Pat1S457E-mediated decrease in autophagy.
A) Autophagy activity was measured by the Pho8Δ60 assay in Pat1-PA, pat1Δ, Pat1-PA EE, Pat1-PA EE ski2Δ, and Pat1-PA EE ski3Δ strains under growing conditions (+N) and after 3 h of nitrogen starvation (−N). Error bars indicate the standard deviation of 6 independent experiments. ANOVA, **P <0.01 and *** P <0.001. B) Autophagy was measured by GFP-Atg8 processing in Pat1-PA, Pat1-PA EE, Pat1-PA EE ski3Δ and Pat1-PA ski3Δ strains under growing conditions and after 2 h of nitrogen starvation; a representative image is shown. C) Atg1, Atg2-PA, Atg7-PA and Atg9 protein levels were measured by western blot in Pat1-HA, Pat1-HA EE, Pat1-HA EE ski3Δ and Pat1-HA ski3Δ strains under growing conditions and after 3 h of nitrogen starvation; a representative image is shown. D) Quantification of the data from (C). Error bars indicate the standard deviation of at least 4 independent experiments. ANOVA, *P <0.05, **P <0.01 and *** P <0.001. E) ATG1, ATG2, ATG7, ATG9, ATG17 and ATG18 mRNA levels were analyzed in Pat1-HA, Pat1-HA EE, Pat1-HA EE ski3Δ and Pat1-HA ski3Δ strains under growing conditions and after 1 h of nitrogen starvation by RT-qPCR. Error bars indicate the standard deviation of at least 8 independent experiments. ANOVA, *** P <0.001.

