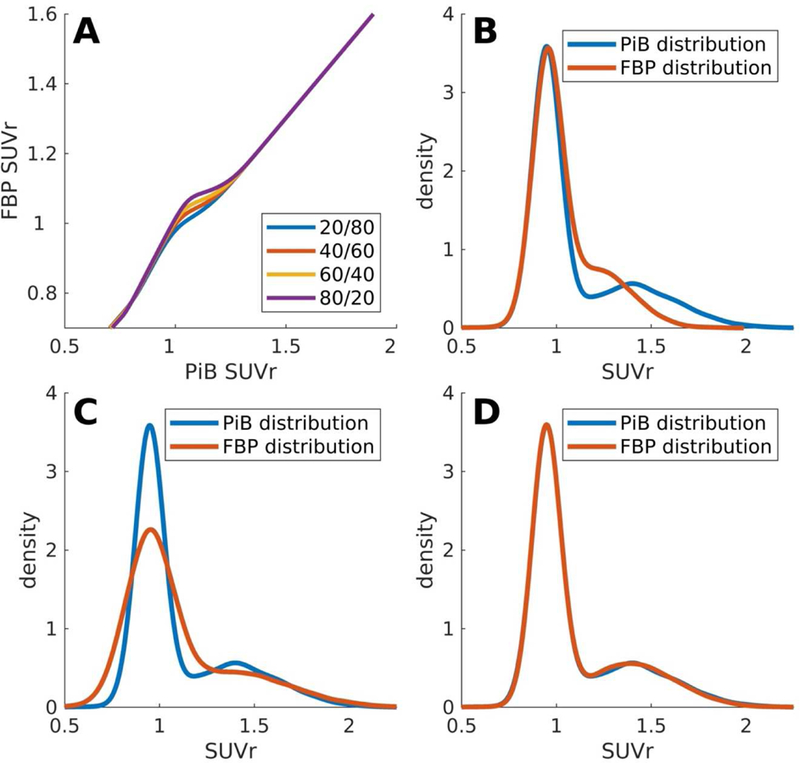
FIGURE 2.

Distributional Transformation: Panel A shows the uncertainty in transforming Aβ-PET data with unknown distributional proportions. With low/high burden proportions creating an uncertainty envelope in the mid range. (Panel B) Raw Aβ-PET values from PiB and FBP show significant differences in their distributions. (Panel C) After linear scaling distributional differences remain. (Panel D) After NoDiM transformation Aβ-PET distributions can be aligned closely, maximizing the probability of transformed burdens aligning.
