
Figure 1 :
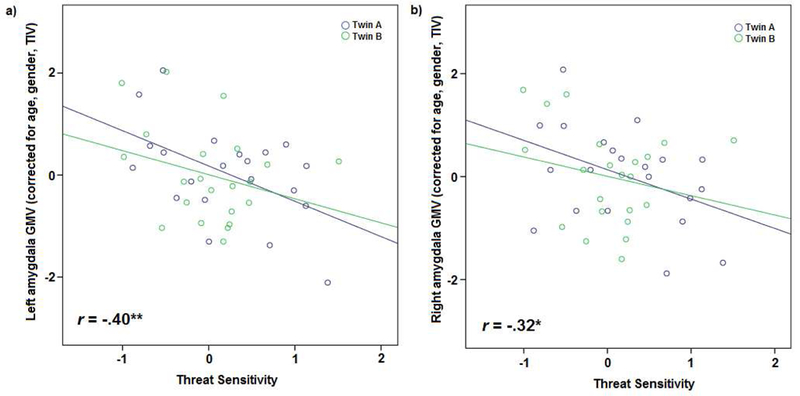
Scatterplots depicting correlations between Biobehavioral Threat Sensitivity score and gray matter volume (GMV) in left (a) and right (b) amygdala for all twin participants (blue: twin A, green: twin B). * = p < .05; ** = p < .01
Official websites use .gov
A
.gov website belongs to an official
government organization in the United States.
Secure .gov websites use HTTPS
A lock (
) or https:// means you've safely
connected to the .gov website. Share sensitive
information only on official, secure websites.
Scatterplots depicting correlations between Biobehavioral Threat Sensitivity score and gray matter volume (GMV) in left (a) and right (b) amygdala for all twin participants (blue: twin A, green: twin B). * = p < .05; ** = p < .01