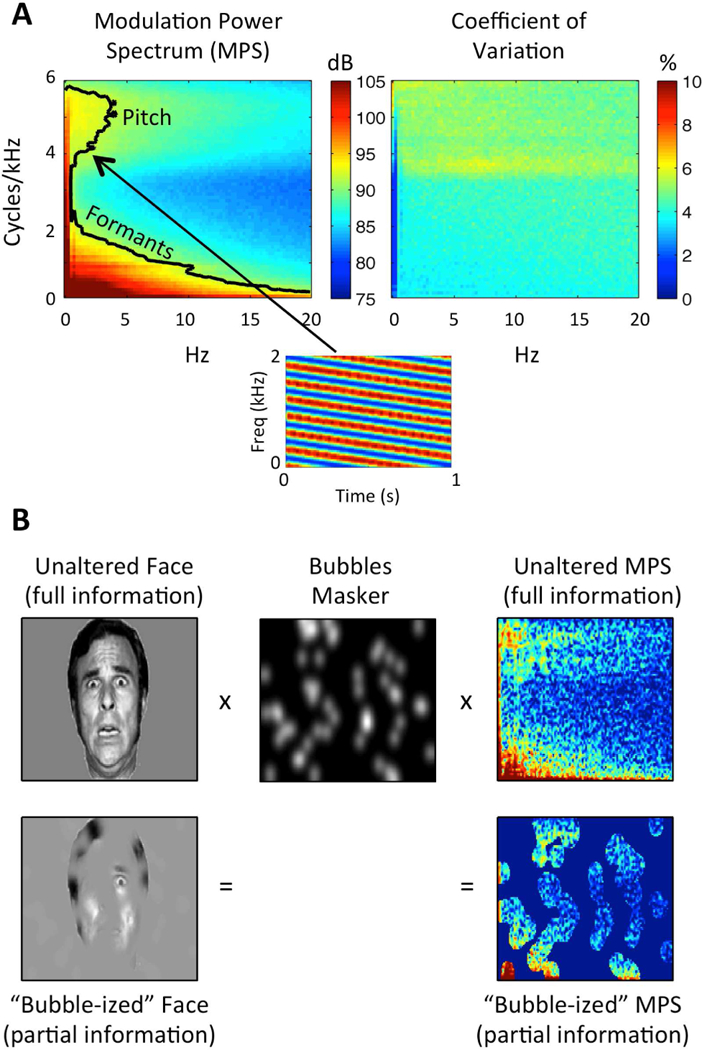
Figure 1.

(A) Speech Modulation Power Spectrum. Left: Average MPS of 452 sentences spoken by a single female talker. The MPS describes speech as a weighted sum of spectrotemporal ripples containing energy at a unique combination of temporal (Hz; abscissa) and spectral (cycles/kHz; ordinate) modulation rate. Modulation energy (dB, arb. ref; color scale) clusters into two discrete regions: a high-spectral-modulation-rate region corresponding to finely spaced harmonics of the fundamental (a “pitch region”) and a low-spectral-modulation-rate region corresponding to coarsely spaced resonant frequencies of the vocal tract (a “formant region”). The black contour line indicates the modulations accounting for 80% of the total modulation power. A spectrogram of an example spectrotemporal ripple (2 Hz, 4 cyc/kHz) is shown beneath. Right: Coefficient of variation across the 452 sentences (sd/mean), expressed as a percentage (color scale). Plotted on the same axes as the MPS. There is relatively little variation across utterances (maximum CV ~7%). (B) Bubbles Procedure. Bubbles (middle) are applied to an image of a face (left) and the MPS of an individual sentence (right). In either case, bubbles reduce the information in the stimulus. Different random bubble patterns are applied across trials of an experiment. For auditory bubbles, we in practice use a binary masker with bubbles that are larger than those shown in the example.
