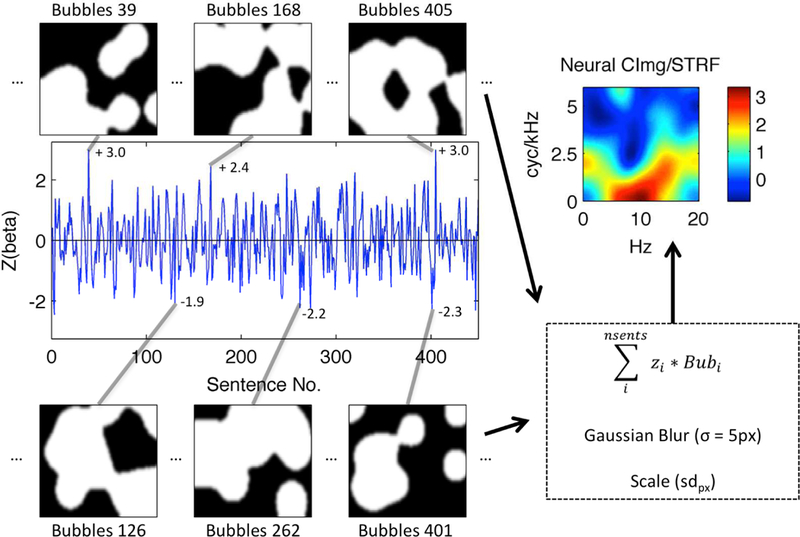
Figure 2. Bubbles Analysis Schematic.

A BOLD activation time-course from a single voxel in left Heschl’s gyrus of a representative subject is shown (blue line). The time-course plots the z-scored time-series of single-trial activation magnitudes (beta; ordinate) evoked by “bubble-ized” sentences (Sentence No., abscissa). Example bubble patterns (black-and-white panels) associated with sentences that evoked relatively large (top) and small (bottom) activations are plotted and identified by their sentence number. Z-scored activation magnitudes associated with these examples are shown next to the corresponding point in the activation time-course. Bubbles are applied to the MPS of each sentence as shown in Fig. 1. White pixels show regions of the MPS that are transmitted to the listener, while black pixels show regions of the MPS that are removed. Each bubble pattern is multiplied by its associated z-score, and the series of bubble patterns is summed pixel-by-pixel. The resulting summed image is then blurred (Gaussian filter with sigma = 5 pixels) and scaled by the across-pixel standard deviation (sdpx). The result is a STRF (top right) showing which regions of the MPS best activated this voxel. The STRF color scale is in across-pixel standard deviation units, where large positive values (yellow-red) correspond to regions of the MPS that evoked relatively large activations.
