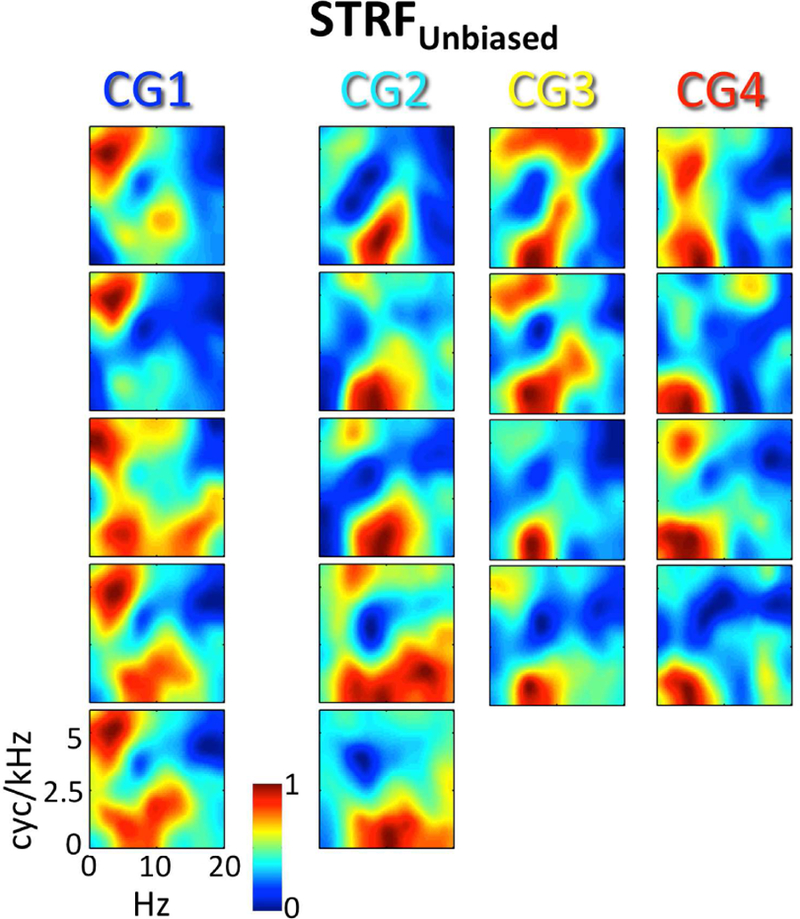
Figure 4. Cluster level STRFs with the global effect of intelligibility removed (STRFUnbiased).

For each of the 18 STRF clusters identified by GMM analysis, the cluster-average group-level (t-score) STRFUnbiased is plotted. STRF magnitudes have been normalized to the range [0, 1]. Larger values are associated with STMs that produced relatively more BOLD activation. STRFs are organized by Cluster Group (CG1–4) in columns running from left to right. Compare to Fig. 3B.
