
Figure 6. Linear Mixed Effects Models: Best Modulation Frequency.
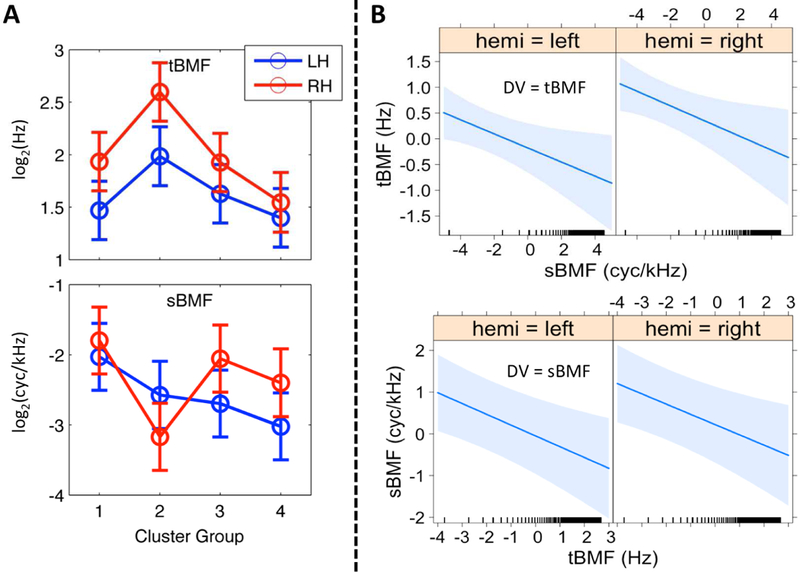
(A) Effect of Cluster Region. The mean of the fitted values produced by the LME model for temporal (tBMF, top) and spectral (sBMF, bottom) best modulation frequencies (octave scale, ordinate) are plotted for Cluster Groups 1–4 (abscissa) in the left (blue) and right (red) hemispheres. Error bars reflect ± 1 SEM. Spectral BMFs are negative because nodes with an sBMF of 0, of which there were many, were set to 0.01 (−6.6 on the octave scale). (B) Covariation between tBMF and sBMF. Results of linear mixed effects regression of sBMF on tBMF (top) and tBMF on sBMF (bottom) by hemisphere are plotted as fitted lines (bold blue) with 95% confidence regions (light blue shading). BMFs have been mean-centered and transformed to the octave scale (i.e., axes show distance from the mean t/sBMF in octaves). Ticks above the abscissa indicate the values of the covariate at which data were actually observed.