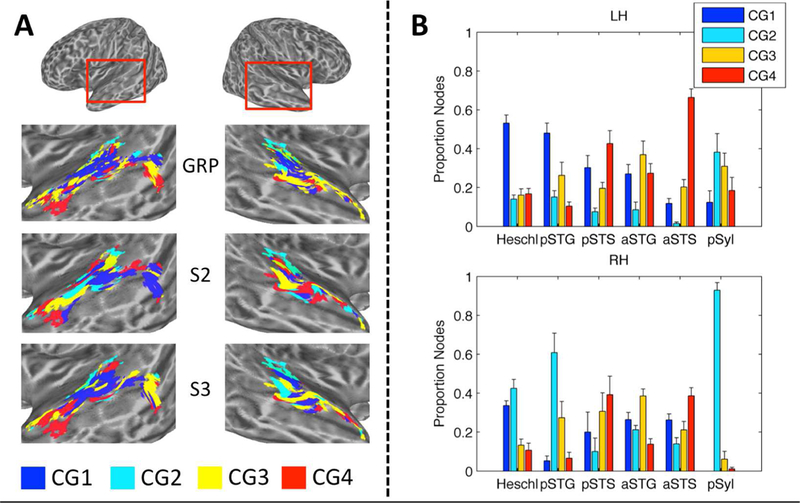
Figure 9.

(A) Cluster-Group Maps at the Group Level and in Representative Individual Participants. Cluster Groups are plotted by color on cortical surface renderings of the left and right hemispheres. Separate maps are shown for the group-level data (GRP), and for the two individual participants with the lowest (S2) and highest (S3) percent agreement with the group. (B) Distribution of Individual-Participant Cluster Groups within Anatomically Defined Regions. The across-participant average proportion of cortical surface nodes belonging to Cluster Group 1–4 is plotted for six anatomical regions of interest in the left (LH) and right (RH) hemispheres: Heschl = Heschl’s gyrus/sulcus, pSTG/S = posterior STG/S, aSTG/S = anterior STG/S, pSyl = posterior Sylvian cortex. Error bars = ± 1 SEM. Compare to Fig. 3D for group-level distributions.
