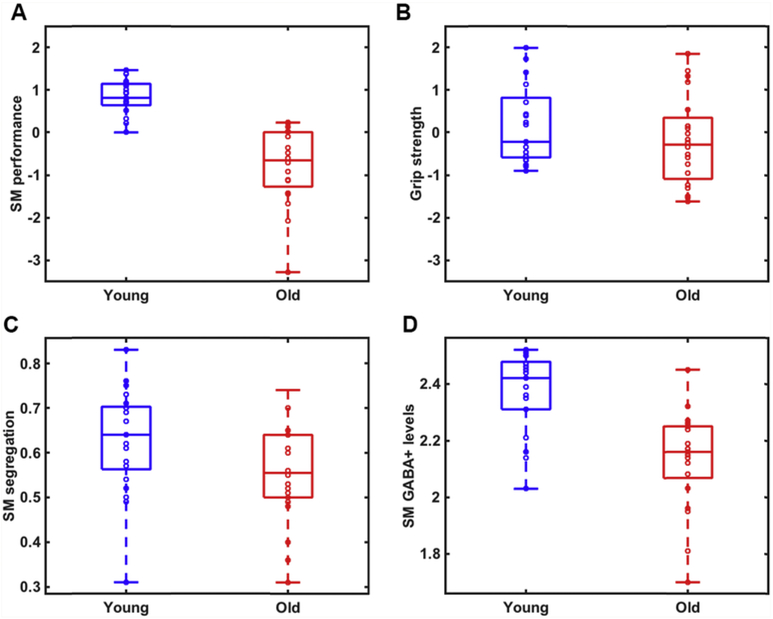
Fig. 3.
Age differences in A) a summary measure of general sensorimotor performance (t = 7.24, p < .001); B) grip strength (t = 1.24, p = .22); C) sensorimotor network segregation (t = 2.23, p = .031); and D) sensorimotor GABA+ levels (t = 4.97, p < .001) between young (blue) and older (red) adults. On each box, the central line indicates the median, and the bottom and top edges of the box indicate the 25th and 75th percentiles, respectively. The whiskers extend to the most extreme data points not considered outliers. (For interpretation of the references to color in this figure legend, the reader is referred to the Web version of this article.)

