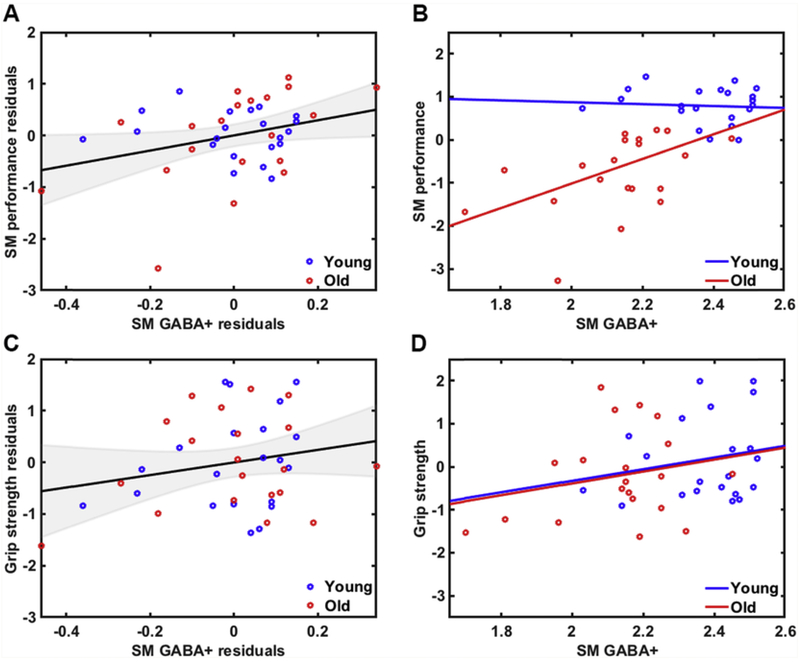
Fig. 6.
A) Relationship between sensorimotor GABA+ levels and sensorimotor performance across all participants (accounting for age and GM volume differences; r = .32, p = .046) and B) within each age group separately (Old: r = 0.48, p = .03; Young: r = −0.14, p = .55). C) Relationship between sensorimotor GABA+ levels and grip strength across all participants (accounting for age and GM volume differences; r = .21, p = .19) and D) within each age group separately (Old: r = 0.23, p = .33; Young: r = 0.20, p = .38).

