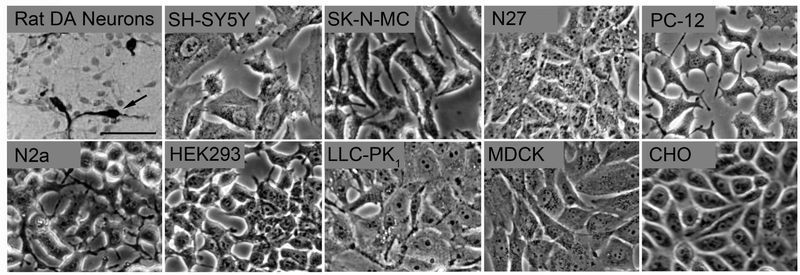
Fig. 1. Morphology of cell systems used to study DAT function and regulation.
Panels show phase contrast microscopic images of several cell systems studied in our labs. Images were acquired using a 20X objective on an inverted Olympus microscope equipped with a digital camera. The scale bar indicates 50 μm and is the same for all panels. The dopaminergic neuron image showing tyrosine hydroxylase positive midbrain neurons (arrow) is modified from (Branton and Clarke, 1999).

