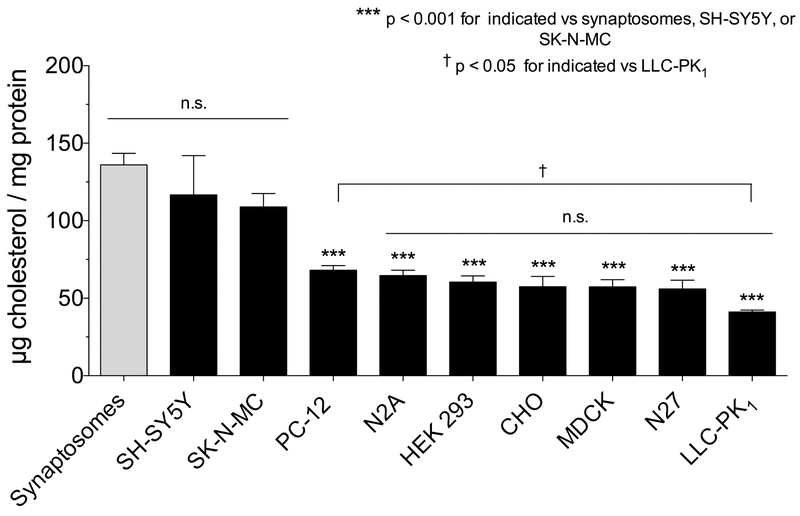
Fig 3. Membrane cholesterol content from DAT model systems.
Membranes were prepared as previously described from cells (Moritz et al., 2013) or rat striatal synaptosomes (Foster and Vaughan, 2011) and assayed for total cholesterol using a colorimetric total cholesterol kit from Fujifilm Wako Diagnostics (Richmond, VA) and total protein using the BCA method as previously described (Foster et al., 2008). Values shown are means ± SEM (n=3-6). Statistical analysis was performed by ANOVA with a Dunnett’s multiple comparison post-hoc test. ***, p<0.001 indicated cells vs. synaptosomes; †, p<0.05 PC-12 cells vs. LLC-PK1 cells; n.s. no statistical difference for indicated groupings.

