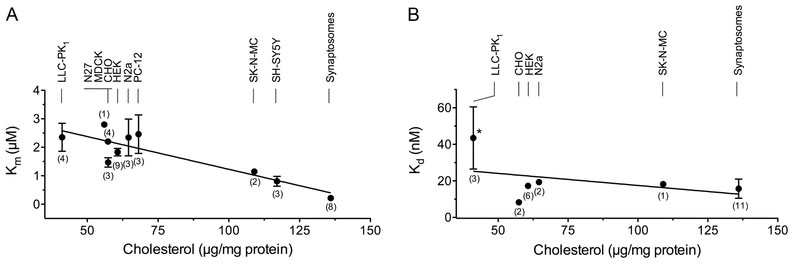
Fig. 4. Inverse correlation between Km and membrane cholesterol content.
(A) Plot of pooled Km(DA) values (means ± SEM) vs. membrane cholesterol for the indicated cell lines and tissues. The line indicates the linear regression analysis (r2=0.78; Pearson correlation coefficient of r = −0.88 ;*** p= 0.0008).(B) Plot of Kd(CFT) values (means ± SEM) vs. membrane cholesterol for the indicated cell lines and tissues. The line indicates linear regression analysis (r2=0.16, Pearson correlation coefficient of r = ‒0.4; p = 0.43). Asterisk indicates significant difference (*, p<0.05) between Kd(CFT) LLC-PK1 vs synaptosomes. Numbers in parentheses indicate the number of reports for each system and where absent error bars lie within the symbol.

