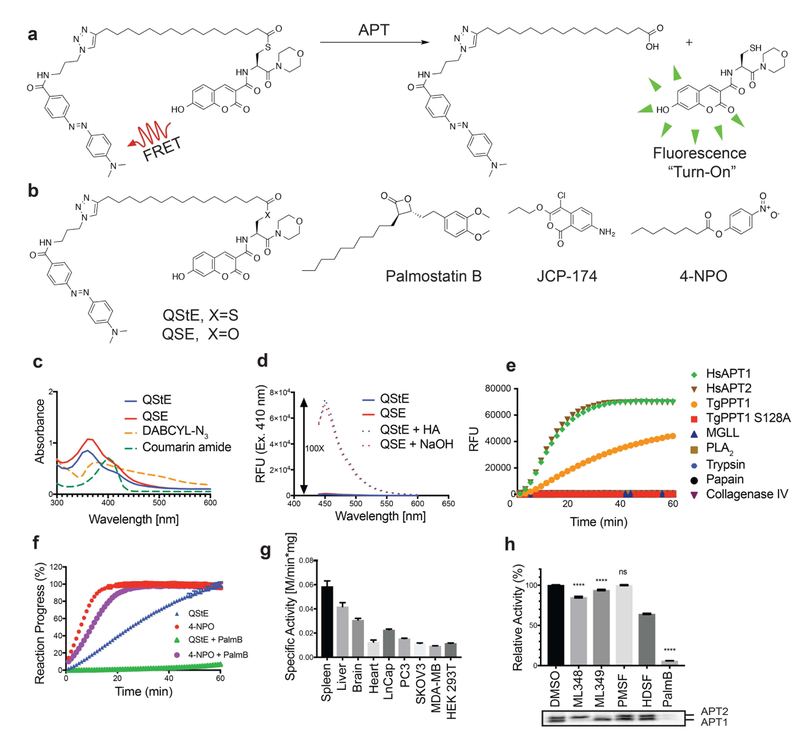
Figure 1: Design of a quenched fluorogenic substrate for depalmitoylases.
a) Overall design of the fluorescently quenched substrate to detect depalmitoylase activity. The substrate contains a S-palmitoyled cysteine carrying a quencher molecule that is released upon thioester hydrolysis by the depalmitoylase, producing a fluorescent peptide product. b) Chemical structures of the thioester (QStE) and ester (QSE) fluorogenic substrates, Palmostatin B, the T. gondii PPT1 specific inhibitor JCP-174 and the general colorimetric esterase substrate 4-nitropehyl octanoate (4-NPO) c) Absorbance spectra of QStE, QSE (at 1 mM) and the precursor fluorophore (Coumarin amide) and quencher (DABCYL-N3). d) Fluorescence spectra of QStE and QSE (at 10 μM, Ex=410 nm, Em=450 nm), before and after chemical hydrolysis with 5% hydroxylamine (HA) or 0.1M sodium hydroxide (NaOH) for 30 minutes. e) Measurement of QStE hydrolysis (at 10 μM) by the indicated recombinant depalmiylases (HsAPT1 at 50 nM, HsAPT2 at 150 nM, and TgPPT1 at 100 nM), esterases (MGLL and PLA2 at 500 nM) and proteases (Trypsin and Papain at 100 nM and Collagenase IV at 1 mg/ml). The catalytically dead TgPPT1 is included as a negative control (TgPPT1 S128A at 100 nM). f) Plot of the hydrolysis of QStE and 4-NPO in mouse liver homogenates in the presence of the general depalmitoylase inhibitor Palmostatin B. Lysates (20 μg) were incubated with DMSO or Palmostatin B (10 μM) for 30 minutes on ice before the addition of substrates (5 μM). g) Specific activity of depalmitoylases measured with QStE in different organ homogenates and cell line lysates. QStE was added to lysates (20 μg) at varying concentrations and the initial rates of hydrolysis were used to calculate the specific activity. h) Relative activity of depalmitoylases measured with QStE in PC3 cell lysate, treated with the isotype-selective inhibitors ML348 and ML349, the general serine hydrolase inhibitor phenylmethylsulfonyl fluoride (PMSF), the serine hydrolase inhibitor hexadecylsulfonyl fluoride (HDSF) and Palmostatin B (PalmB). Lower panel shows the residual activity of APT1 and APT2 (as indicated) after treatment with each inhibitor by labeling lysates with the ABP fluorophosphonate-rhodamine (FP-Rho). Lysates (at 20 μg) were incubated with DMSO or inhibitors (10 μM) for 30 minutes on ice before the addition of QStE (5 μM). Error bars represent S.D. of three replicates. Statistical significance is calculated using ordinary oneway ANOVA compared with DMSO (**** P=0.001, n.s. P=0.9999). See also figure S3.

