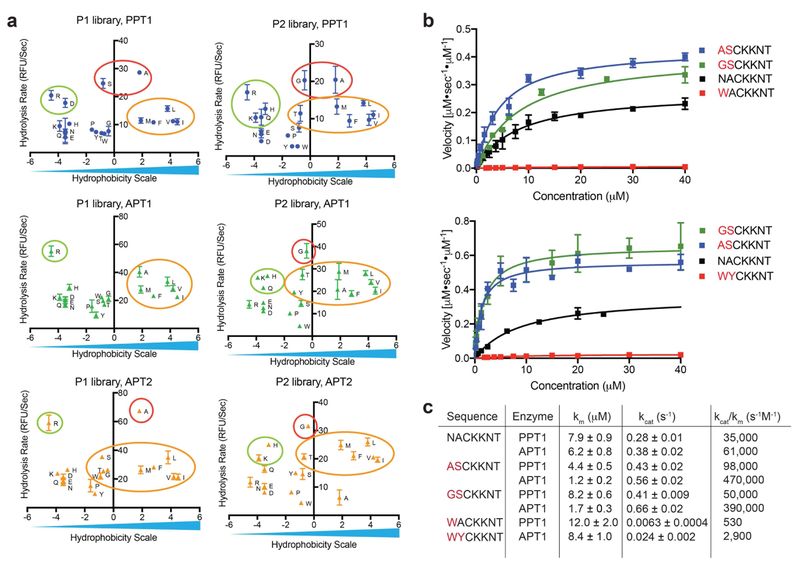
Figure 3: Validation of substrate specificity using fluorogenic peptides designed from the library screening data.
a) Rates of hydrolysis for each amino acid substitution, measured with P1 or P2 libraries plotted relative to a hydrophobicity scale (adopted from Kyte and Doolittle(Kyte and Doolittle, 1982)). Small aliphatic residues (red circles) are favored at positions P1 and P2 and result in fast hydrolysis rates, positively charged residues (green circles) as well as hydrophobic aliphatic residues (yellow circles) result in moderate hydrolysis rates for all three depalmitoylases. b) Michaelis Menten plots showing rates of hydrolysis of the indicated fluorogenic peptides synthesized based on data from the positional scanning libraries. Each point represents mean and standard deviation of three replicates c) Catalytic rates and efficiencies of the fluorogenic peptides derived from the Michaelis Menten plots in (b). See also table S1 and figure S1 and S2.

