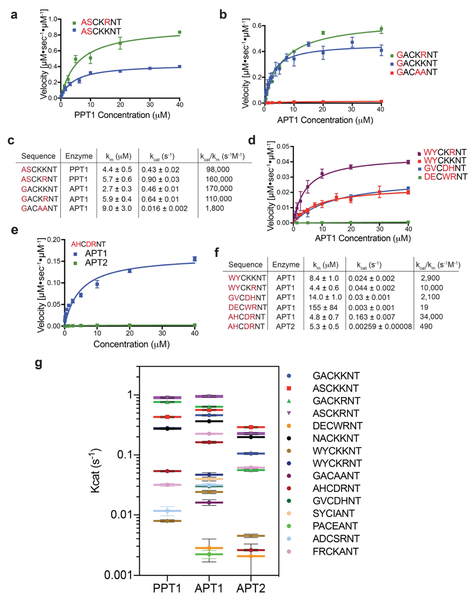
Figure 5: Engineering of fluorogenic peptide substrates based on substrate specificity profiles.
Michaelis Menten plots comparing the kinetic curves of optimized peptides, measured with (a) TgPPT1 or (b) HsAPT1. Each point represents the mean and standard deviation of three replicates. c) Catalytic efficiencies of the fluorogenic peptides derived from the Michaelis Menten plots in (a) and (b). d) Michaelis Menten plot comparing kinetic curves of suboptimized and least optimized peptides measured for HsAPT1. e) Activity of the selective substrate AHC20DRNT for HsAPT1 and HsAPT2. f) Catalytic efficiencies of the fluorogenic peptides derived from the Michaelis Menten plots in (d) and (e). g) Plot of Kcat values for the indicated fluorogenic substrates for TgPPT1 HsAPT1 and HsAPT2. Error bars represent S.D. of three replicates. See also table S1 and figures S1, S2 and S6.

