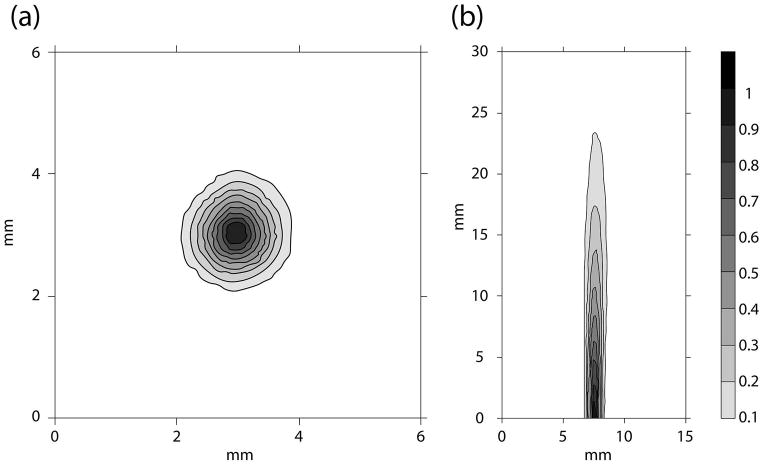
Figure 2.
The (a) transverse (4mm from the cone surface) and (b) axial cross-sections (starting from 2mm from the cone surface) of the ultrasound beam mapped out with a hydrophone in degassed water. The beam plots were performed with the cone attached (Figure 1). As shown in (b), the focal zone was adjusted such that it was near the surface of the cone where the top of the tumor would be positioned.

