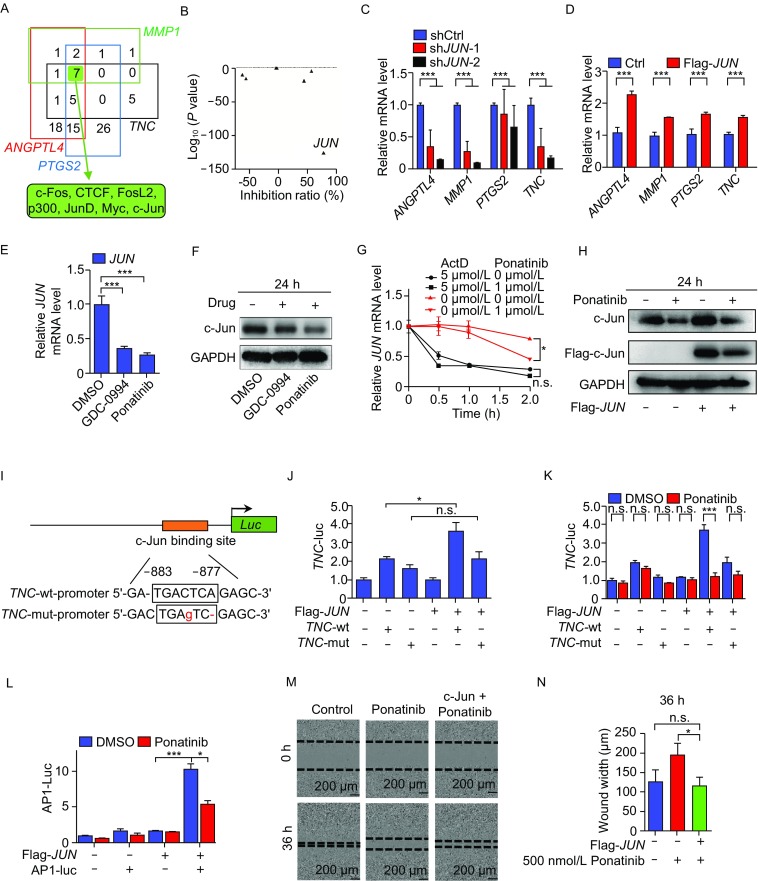
Figure 5.

Ponatinib inhibits the expression of certain BCLM-associated genes and cell migration via the transcription factor c-Jun. (A) Transcription factors that bind to the promoters of 4 BCLM-associated genes down-regulated by Ponatinib in ENCODE ChIP-seq data. The numbers in each color box represent the number of transcription factors bound to the promoter region of each BCLM related genes (group), the shared 7 transcription factors in four groups were marked with a green solid box. (B) Gene expression analysis of these 7 transcription factors in (A) when LM2 cells were treated with Ponatinib. (C and D) RT-qPCR analysis of the expression of 4 BCLM-associated genes in LM2 cells with knockdown (C) or overexpression (D) of JUN. (E) RT-qPCR analysis of JUN mRNA expression in LM2 cells treated with 1 µmol/L Ponatinib or 10 µmol/L GDC-0994 for 24 h. (F) Western blot analysis of the protein level of endogenous c-Jun in LM2 cells treated with 1 µmol/L Ponatinib or 10 µmol/L GDC-0994 for 24 h. (G) LM2 cells were treated with 1 µmol/L Ponatinib and 5 µmol/L actD for the indicated time, RT-qPCR was used to analyze the JUN mRNA expression. (H) LM2 cell were transfected with c-Jun or empty vector for 48 h, then treated with DMSO or 1 µmol/L Ponatinib for 24 h, Western blot analysis of the protein level of endogenous or transfected c-Jun. (I) Schematic representation of the location of the c-Jun DNA binding site (AP1) in the TNC promoter. (J and K) LM2 cells were transfected by luciferase reporter vectors driven by TNC wild-type or mutant promoters and JUN overexpression or control vectors. Next, luciferase activity was determined (J); or transfected cells were treated with DMSO or 1 µmol/L Ponatinib for 24 h, then luciferase activity was examined (K). (L) Suppression of AP1 site-Luc activity by Ponatinib in c-Jun-overexpressing LM2 cells. (M and N) MDA-MB-231 cells were transfected with c-Jun or empty vector for 48 h, and treated with DMSO or 500 nmol/L Ponatinib. Cells were scratched and the wound width was photographed. Representative images of one of three independent experiments are shown (M) and quantified (N) among the three groups at 36 h after Ponatinib treatment. Data represent mean ± SD of three independent experiments in (C–H, J–L and N). Two-tailed Student’s t-test were performed in (C–E, J–L and N), ***P < 0.001, **P < 0.01, *P < 0.05
