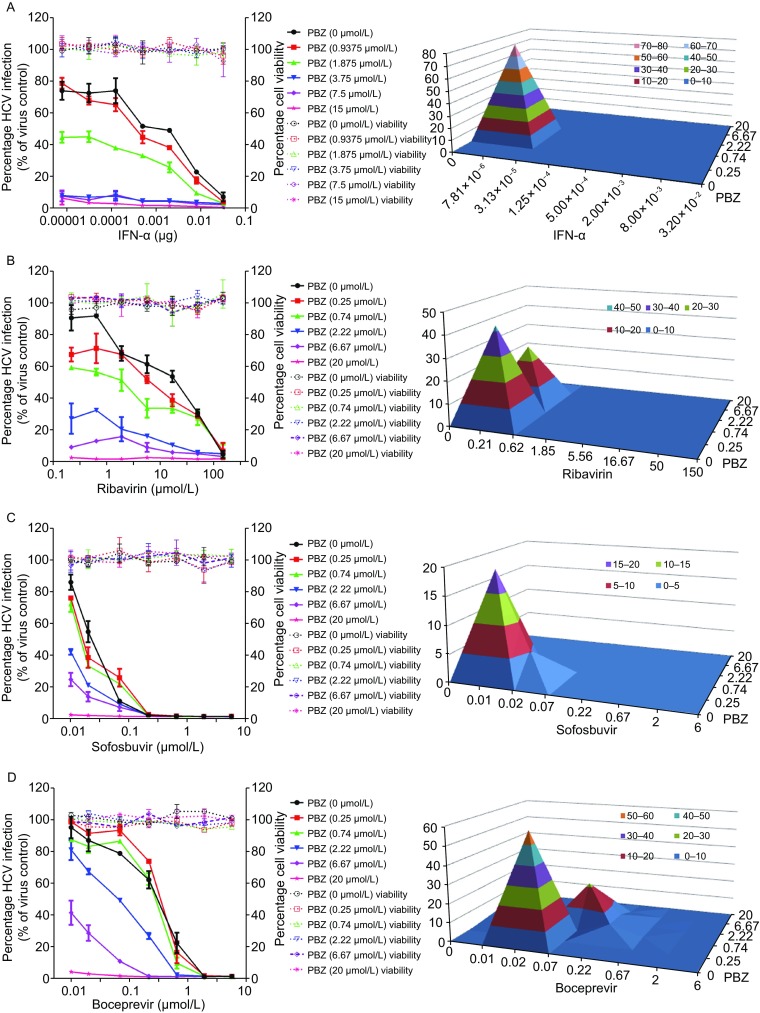
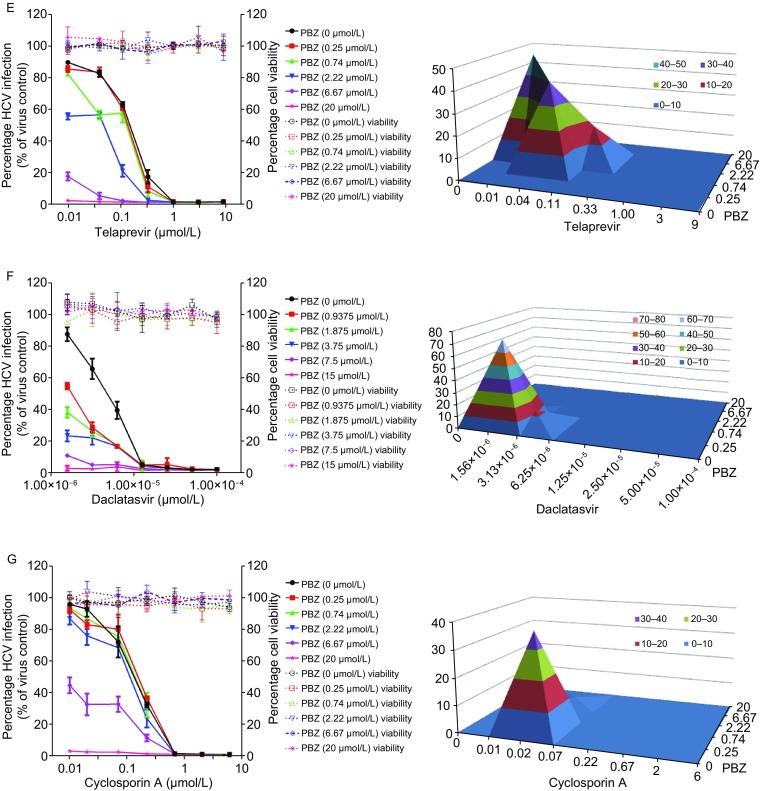
Figure 5.


Drug-drug interaction of PBZ with selected different classes of anti-HCV drugs. Huh7.5.1 cells infected by HCVcc were treated with various concentrations of PBZ, IFN-α (A), ribavirin (B), sofosbuvir (C), boceprevir (D), telaprevir (E), daclatasvir (F) and cyclosporin A (G) alone, or in combinations at the indicated concentrations for 48 h. Antiviral activities were determined by measuring the reduction of luciferase activity in the cells. Differential surface plot at the 95% confidence level (CI) were calculated and generated by using MacSynergy II for the drug–drug interaction in the right panels. The 3-dimensional plot represents the differences between the actual experimental effects and the theoretical additive effects at various concentrations of two compounds in combination. Peaks above the theoretical additive plane indicate synergy. Only statistically significant (95% CI) differences between the two compounds were considered at any given concentration. The level of synergy is represented by the log volume values, and color-coded automatically. The level of synergy was defined in MacSynergy as moderate synergy (5 ≤ log volume < 9) and strong synergy (log volume ≥ 9). Results are graphed as the mean ± SD for duplicate samples
