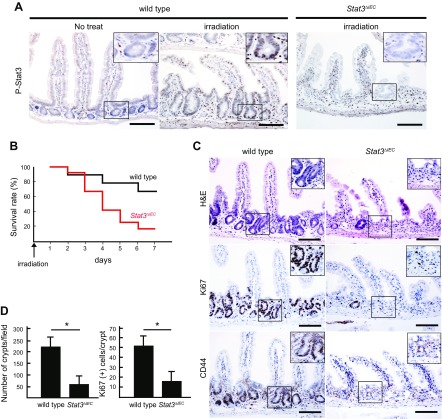
Figure 1 .
Histologic analysis of X-ray–irradiated mouse small intestine. A) Representative sections immunohistochemically stained for P-Stat3 in small intestine of control WT and irradiated WT and irradiated Stat3ΔIEC mice. Scale bars, 100 μm. Insets indicate enlarged images of boxed areas. B) Survival rate of WT and Stat3ΔIEC mice after X-ray irradiation (n = 9 for WT and n = 12 for Stat3∆IEC mice). C) Representative histology sections from WT (left) and Stat3ΔIEC (right) mouse intestines (H&E) (top) and immunohistochemical staining for Ki-67 (middle) and CD44 (bottom). Insets show enlarged image views of boxed areas. Scale bars, 100 μm. D) Number of crypts in microscopy fields (left) and Ki-67–positive cells per crypt (right) are shown (means ± sd). *P < 0.05.

