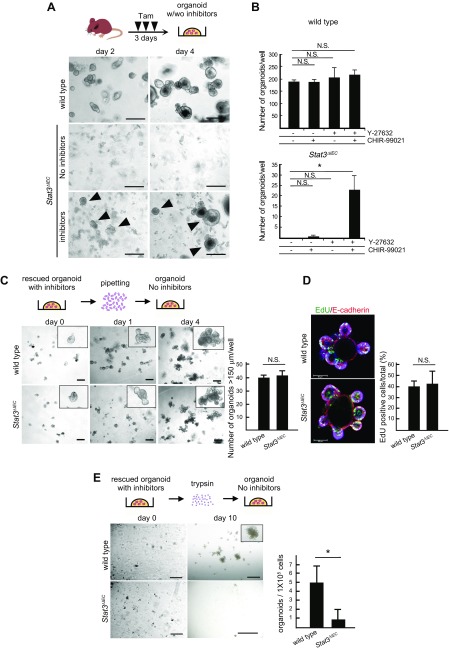
Figure 2 .
Role of Stat3 in organoid formation from intestinal crypts. A) Schematic illustration of Tam treatment and organoid formation (top). Representative microscopic photographs of organoid cultures of intestinal crypts of WT and Stat3ΔIEC mice on d 2 (left) and d 4 (right). Arrowheads indicate organoids rescued by inhibitors (Y-27632 and CHIR-99021). Scale bars, 250 μm. B) Numbers of organoids per well developed from intestinal crypts of WT (top) and Stat3ΔIEC mice (bottom) in indicated inhibitor conditions (means ± sd). *P < 0.05. Inhibitor treatment experiments were performed 3 times for each mouse genotype. C) Schematic illustration of organoid passaging by mechanical pipetting (top). Representative microscopic photographs of organoids passaged from WT and Stat3ΔIEC rescued organoids (bottom). Insets show enlarged views. Scale bars, 250 μm. Numbers of organoids >150 µm are shown in bar graph (means ± sd). Mechanical passage experiments were performed 3 times. D) Immunohistochemical staining of WT (top) and Stat3ΔIEC (bottom) rescued organoids for EdU (green) and E-cadherin (red). EdU labeling efficiency is shown in bar graph (means ± sd). Scale bars, 50 μm. E) Schematic illustration of organoid passaging by trypsin treatment (top). Representative microscopic photographs of organoids passaged from WT (top) and Stat3ΔIEC-rescued organoids (bottom). Scale bars, 200 μm (d 0) and 1 mm (d 10). Numbers of organoids are shown in bar graph (means ± sd). *P < 0.05. Enzymatic passage experiments were performed 3 times. N.S., not significant.

