Figure 3 .
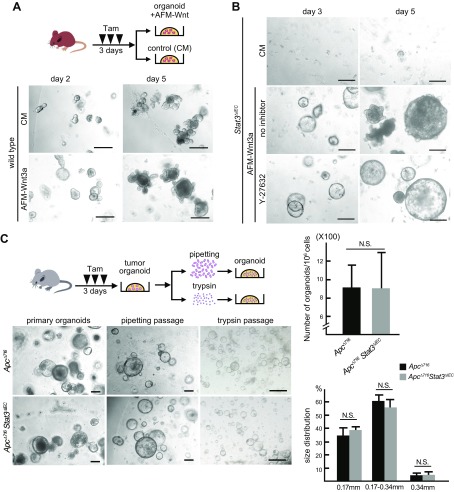
Wnt activation compensates for Stat3 disruption to support organoid formation. A) Schematic illustration of Tam treatment and organoid formation (top). Representative microscopic photographs of organoids of intestinal crypts from WT mice cultured with control medium (top) and AFM-Wnt3a (bottom) on d 2 (left) and d 5 (right). Scale bars, 250 μm. B) Representative microscopic photographs of organoid cultures of intestinal crypts from Stat3ΔIEC mice cultured with control medium (top), AFM-Wnt3a without inhibitor (middle), and with inhibitor (bottom) on d 3 (left) and d 5 (right). Scale bars, 250 μm. C) Schematic illustration of Tam treatment, tumor-derived organoid formation, and treatment with pipetting or trypsin to passage (top). Representative photomicrographs of primary organoids (left; scale bars, 250 μm) and organoids passaged by pipetting (middle; scale bars, 250 μm), and trypsin treatment (right; scale bars, 500 μm) derived from intestinal tumors of ApcΔ716 simple mutant mice (top) and ApcΔ716 Stat3ΔIEC compound mice (bottom). Numbers of organoids (top) and size distributions (bottom) after passaging with trypsin treatment in respective genotype are shown in bar graphs (means ± sd). Experiments were performed 3 times.

