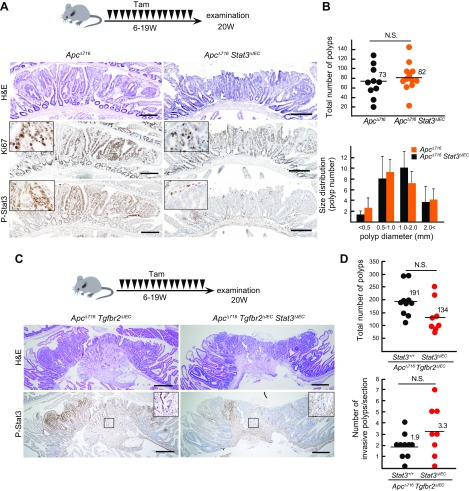
Figure 4 .
Dispensable role of Stat3 in Wnt-driven intestinal tumorigenesis. A) Schematic illustration of Tam treatment of ApcΔ716 mice (n = 10) and Apc∆716 villin-CreER Stat3flox/flox mice (n = 12) (top). Representative histology sections of small intestinal tumors of ApcΔ716 mice (left) and ApcΔ716 Stat3ΔIEC mice (right) for H&E (top) and immunohistochemical staining for Ki-67 (middle) and phosphorylated Stat3 (P-Stat3) (bottom). Insets show enlarged views. Scale bars, 200 μm. B) Total numbers of polyps in each mouse are shown with dots with mean values (top). Size distribution is shown in bar graph (means ± sd). C) Schematic illustration of Tam treatment of ApcΔ716 villin-CreER Tgfbr2flox/flox mice (n = 10) and ApcΔ716 villin-CreER Tgfbr2flox/flox Stat3flox/flox mice (n = 8) (top). Representative histology sections of small intestinal tumor of ApcΔ716 Tgfbr2ΔIEC mice (left) and ApcΔ716 Tgfbr2ΔIEC Stat3ΔIEC mice (right) for H&E (top) and immunohistochemical staining for P-Stat3 (bottom). Insets show enlarged views of boxed areas. Scale bars, 400 μm. D) Total numbers of polyps (top) and invasive polyps (bottom) per section are shown with mean numbers.

