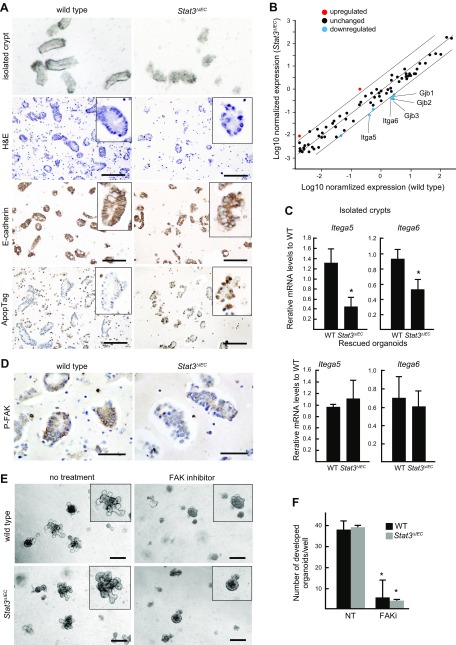
Figure 6 .
Stat3-dependent integrin expression and FAK activation. A) Representative photographs of isolated crypts under dissection microscope, histologic section of isolated crypts (H&E), and immunohistochemical staining for E-cadherin and ApopTag (from top to bottom) of WT (left) and Stat3ΔIEC isolated intestinal crypts (right). Insets show enlarged views. Scale bars, 100 μm. B) Results of filter array expression analysis are shown in dot graph, which displays up-regulated (>4 fold) and down-regulated (<0.25 fold) genes in Stat3ΔIEC crypts in different colors. C) Relative mRNA levels in isolated crypts (top) and rescued organoids (bottom) (means ± sd) were examined by RT-PCR for Itga5 and Itga6. *P < 0.05. D) Isolated crypts from WT (left) and Stat3∆IEC mice (right) subjected to immunohistochemical staining for P-FAK. Scale bars, 50 μm. E) Representative microscopic photographs of organoids derived from WT (top) and Stat3∆IEC mouse (bottom) crypts in absence (left) or presence (right) of FAK inhibitor in Matrigel. Insets show enlarged views. Note that crypt growth was suppressed by FAK inhibitor regardless of genotype. Scale bars, 250 μm. F) Numbers of developed organoids (budding number >5) in Matrigel with or without FAK inhibitor (FAKi and NT, respectively) (means ± sd). *P < 0.05 vs. NT.

