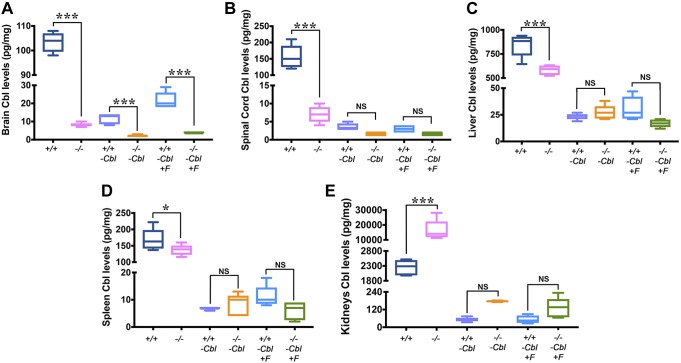
Figure 1 .
Cbl levels in the Cd320+/+ and the Cd320−/− groups. A–D) Brain tissue showed significantly lower levels of Cbl in all groups fed a Cbl-deficient diet vs. their respective groups fed a normal diet. Mice fed a Cbl-deficient diet also showed significantly reduced Cbl levels in the SC (B), liver (C), and spleen (D). No significant differences were observed in Cd320−/− and Cd320−/−-F+ groups in Cbl levels compared with their respective wild-type groups fed a Cbl-deficient diet. E) On the other hand, kidneys showed significantly increased levels of Cbl accumulation in Cd320−/− mice fed a normal diet. Values are expressed as picograms per milligram wet weight. For all box plots, the vertical line indicates range, the box includes the second and third quartiles, and the horizontal line within the box indicates median (n = 5 for each group). *P < 0.05, ***P < 0.001.

