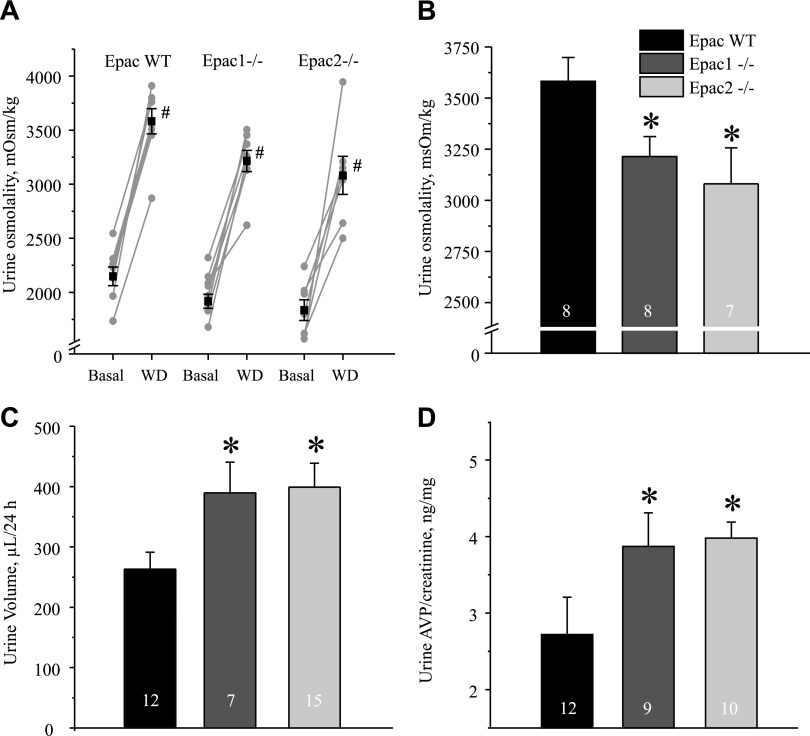
Figure 7 .
Epac1−/− and Epac2−/− mice have impaired urinary concentrating ability. A) Summary graphs of changes in urinary osmolarity at baseline (basal) and after 24 h of water deprivation (WD) for Epac WT, Epac1−/−, and Epac2−/− mice placed in metabolic cages. Individual paired experiments are shown by connected lines. B) Summary graph of urine osmolarity after 24 h of water deprivation in Epac WT, Epac1−/−, and Epac2−/− mice. C, D) Summary graphs of urine volume (C) and urinary AVP normalized to respective creatinine levels (D) in Epac WT, Epac1−/−, and Epac2−/− mice subjected to 24 h of water deprivation. *P < 0.05 vs. Epac WT. #P < 0.05 vs. respective value under baseline conditions. Number of mice in each group is indicated on each bar.

