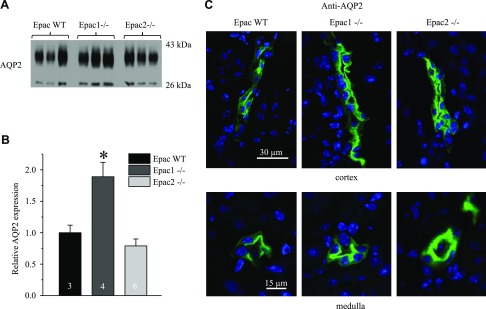
Figure 9 .
AQP2 expression in Epac1−/− and Epac2−/− mice after water deprivation. A) Representative Western blots from whole kidney lysates of Epac WT, Epac1−/−, and Epac2−/− mice subjected to 24 h of water deprivation probed with anti-AQP2 antibodies. AQP2 is present as upper duplet of glycosylated bands around 37 kDa and lower nonglycosylated band at 29 kDa. B) Summary graph comparing total renal AQP2 expression (both glycosylated and nonglycosylated forms) in Epac WT, Epac1−/−, and Epac2−/− from Western blots similar to that shown in A. Intensity values were normalized to total signal of respective lines in Ponceau red staining. Number of mice in each group is indicated on each bar. C) Representative confocal micrographs of cortical (top) and medullary (bottom) CDs in transverse cut kidney sections probed with anti-AQP2 (pseudocolor green) from Epac WT, Epac1−/−, and Epac2−/− mice subjected to 24 h of water deprivation. Nuclear DAPI staining is shown in pseudocolor blue. Number of mice in each group is indicated on each bar. *P < 0.05 vs. Epac WT.

