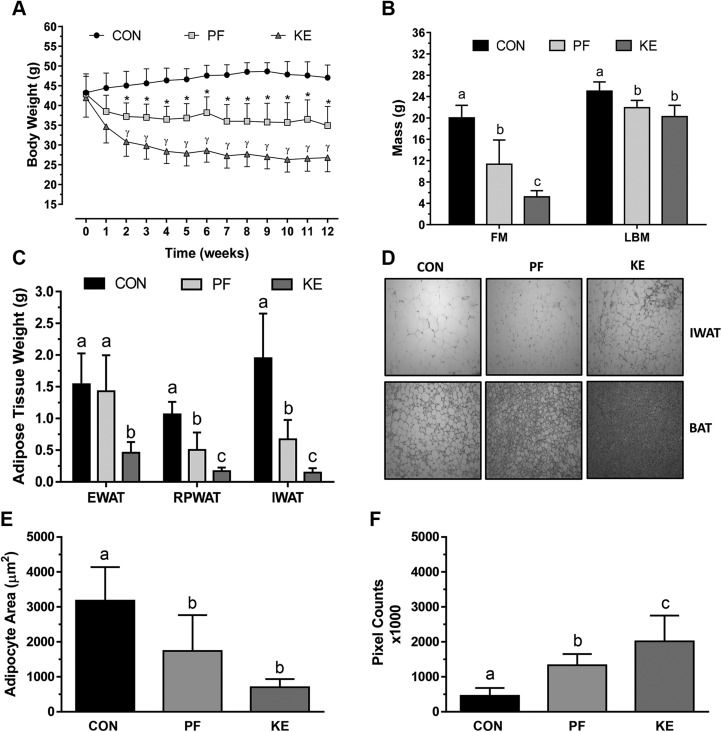
Figure 1 .
Differences in body weight and body composition. A) Body weight responses to 12 wk of Con, PF, or KE diet. *P < 0.001, Con vs. PF beginning at wk 2; γP < 0.001, all group comparisons beginning at wk 2. B) Final FM and LBM among groups. P < 0.001. C) Final adipose tissue weights for epididymal (EWAT), retroperitoneal (RPWAT), and IWAT. Data are presented as means ± sd. Different letters indicate significant differences between groups. P < 0.05. D) Representative hematoxylin and eosin images of interscapular BAT sections. Original magnification, ×20. E) WAT area was determined by ImageJ. F) Because of the characteristic presence of multilocular adipocytes in BAT, we developed a procedure in ImageJ with the Histogram feature to count enhanced pixels in the red mode of RGB. Lipid droplets are not included within red pixilation, and thus greater amounts of pixilation represent lower lipid content.

