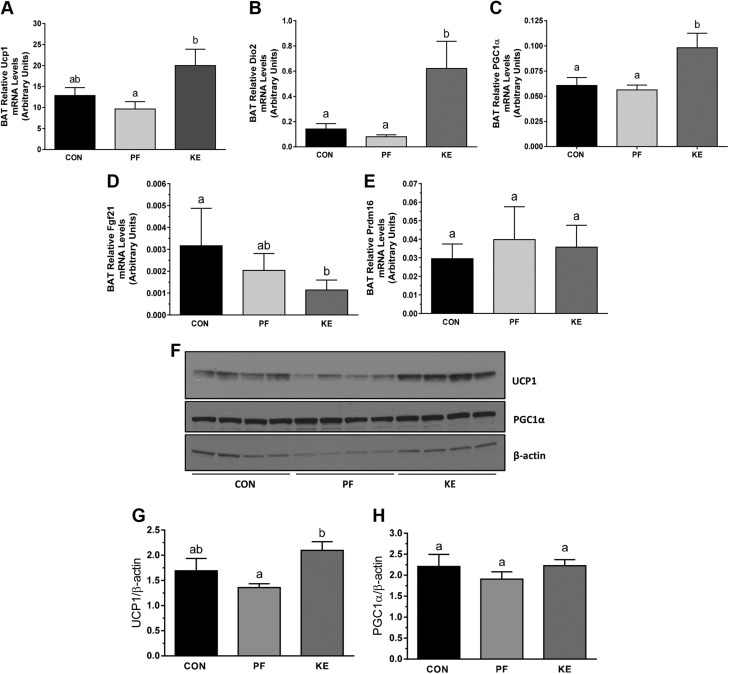
Figure 4 .
Mitochondrial thermogenic and biogenic expression in BAT. A–E) Relative Ucp1 (A), Dio2 (B), Pgc1a (C), Fgf21 (D), and Prdm16 (E) gene expression in interscapular BAT. F) Representative images of protein expression for UCP-1 and PGC-1α with quantification. Data are means ± sd. P < 0.05, different letters indicate statistically significant differences.

