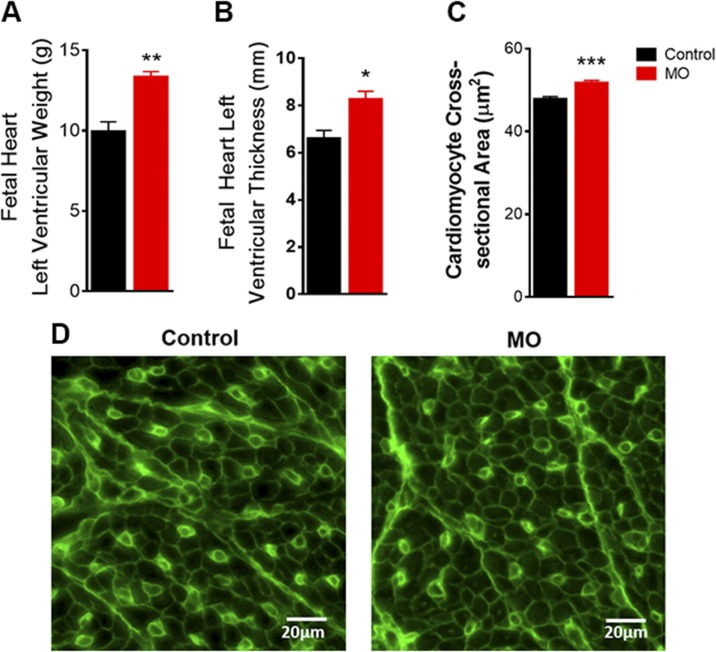
Figure 1 .
LV biometric properties in 0.9 gestation fetuses of control and MO mothers. A) LV weight (n = 5 control fetuses and n = 4 MO fetuses). B) LV thickness (n = 7 control fetuses and n = 7 MO fetuses). C) Cardiomyocyte cross-sectional area, ∼1000 cells (∼178–258 per animal) randomly selected from 5 control and 5 MO fetal hearts. D) Representative images with WGA staining of cardiomyocyte cross-sectional area of LV tissues. Means ± sem. *P < 0.05, **P < 0.01, ***P < 0.001 vs. control.

