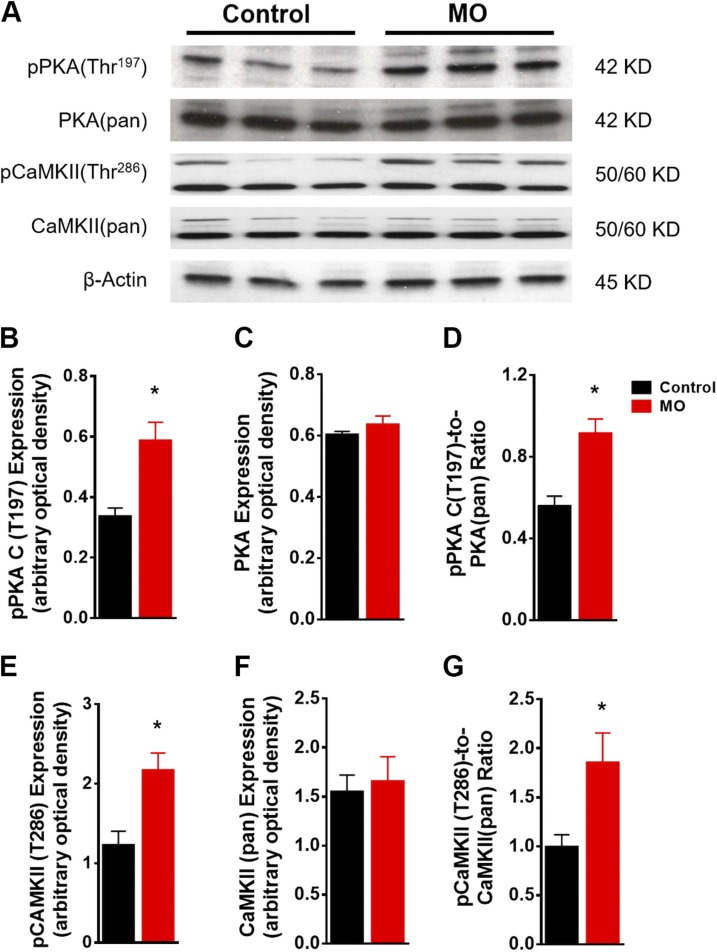
Figure 5 .
Western blot of kinases active in Ca2+ signaling in control and MO 0.9 gestation fetal heart LVs. SDS-PAGE gel image of pPKA (Thr197), PKA(pan), pCaMKII(Thr286) and CaMKII(pan) (A); pPKA(Thr197) expression (B); PKA(pan) expression (C); pPKA(Thr197)-to-PKA(pan) ratio (D); pCaMKII(Thr286) expression (E); CaMKII(pan) expression (F); and pCaMKII(Thr286)-to-CaMKII(pan) ratio (G). Means ± sem. (B, C, E, and F, n = 6 control fetal hearts and n = 7 MO fetal hearts, normalized to β-actin expression; D, and G to relative pan protein expression). *P < 0.05 vs. control.

