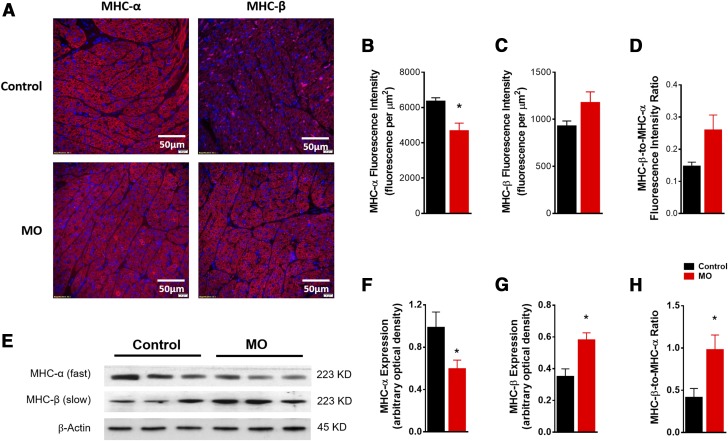
Figure 6 .
MHC expression in control and MO 0.9 gestation fetal heart LVs. Representative images of immunofluorescence staining of cardiac MHC-α (red), MHC-β (red) in fetal LV tissue, nucleus stained by DAPI (blue) (A); mean fluorescence intensity of MHC-α (B); mean fluorescence intensity of MHC-β (C); fluorescence intensity of MHC-β:MHC-α ratio (D); SDS-PAGE gel image of MHC-α and -β (E); MHC-α expression (F); MHC-β expression (G); MHC-β:MHC-α expression ratio (H). Means ± sem. (F and G, n = 6 control fetal hearts and n = 7 MO fetal hearts, normalized to β-actin expression; H, normalized to MHC-α protein expression). *P < 0.05 vs. control.

