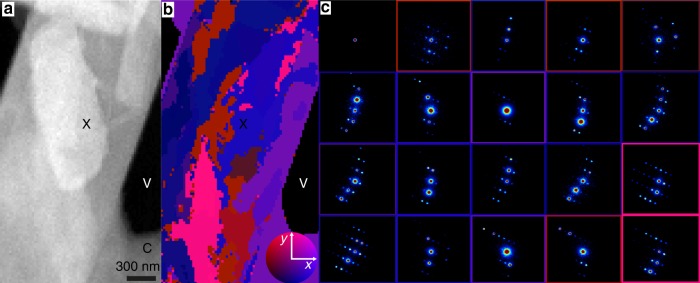
Fig. 3.
Mapping of nanoscale lattice reorientation within peptide nanocrystals by 4DSTEM. a HAADF image of a QYNNQNNFV nanocrystal. Unsupervised classification of diffraction patterns captured by the 4DSTEM scan acquired during the measurement of a are shown in b; this is a map of diffraction clusters not obvious from a. Colours in b illustrate the change in lattice orientation for each individual cluster with respect to the mean orientation across the scan area. The colour wheel (inset) demonstrates the relative orientation away from the mean in x and y tilts; maximum deviation denoted by the colour wheel is 4°. Average diffraction patterns from diffraction outlined in b are shown in c, where the colour of the bounding box corresponds to the colour of the corresponding cluster in b. C, X and V indicate carbon support, peptide crystal and vacuum, respectively

