Fig. 3.
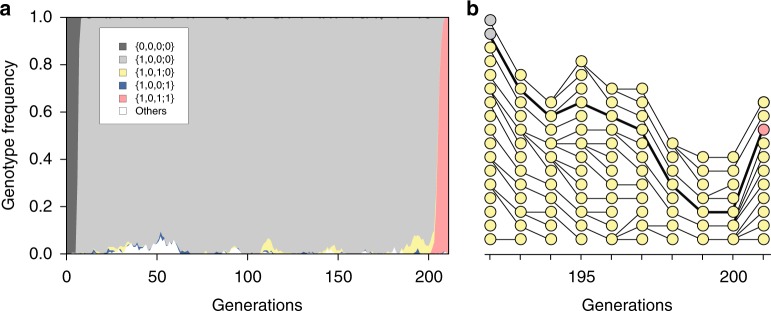
Simulated evolutionary dynamics. a In most cases, the population of the ancestral genotype {0,0,0;0} (dark gray) was quickly taken over by the genotype {1,0,0;0} (light gray); the genotype {1,0,1;0} (yellow) as well as other genotypes then arose but remained at low frequencies; and the final genotype {1,0,1;1} (red) arose from {1,0,1;0} and quickly became fixed. The whole population showed a state transition from all-{1,0,0;0} to all-{1,0,1;1}. b Selected genealogies of the genotype {1,0,1;0} during generations 192 and 201 shown in a. Circles denote swarms, with colors as in a. This includes the genealogy leading to the final genotype {1,0,1;1}. The regulatory trait b3 = 1 predated the evolution of pheromone responsiveness trait p = 1 along the focal genealogy

