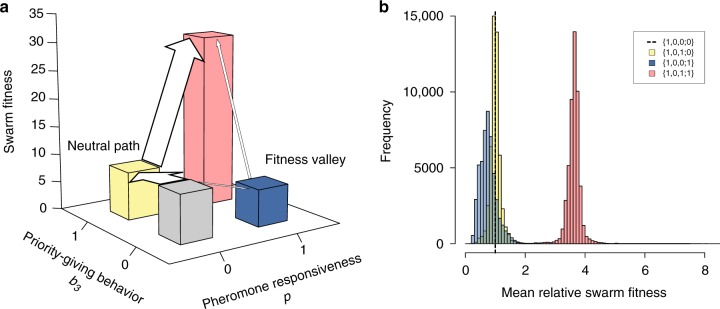
Fig. 4.
a Schematic diagram of fitness landscape involving the core (p) and regulatory (b3) traits of the self-organizing capacity. Starting from the genotype {1,0,0;0} (light gray), the swarm fitness of the genotype {1,0,0;1} (blue) is generally lower than that of the genotype {1,0,1;0} (yellow), making the latter more likely to arise first (depicted by the thicker arrow) and to serve as the precursor of the final genotype {1,0,1;1} (red). Height of the bars corresponds to swarm fitness in Supplementary Figure 1. b Resampled distribution of relative swarm fitness of the neutral intermediate {1,0,1;0} (yellow), inferior intermediate {1,0,0;1} (blue), and final {1,0,1;0} (red) genotypes, compared with the original genotype {1,0,0;0} (− − −). The distributions were incorporated into the mathematical analysis

