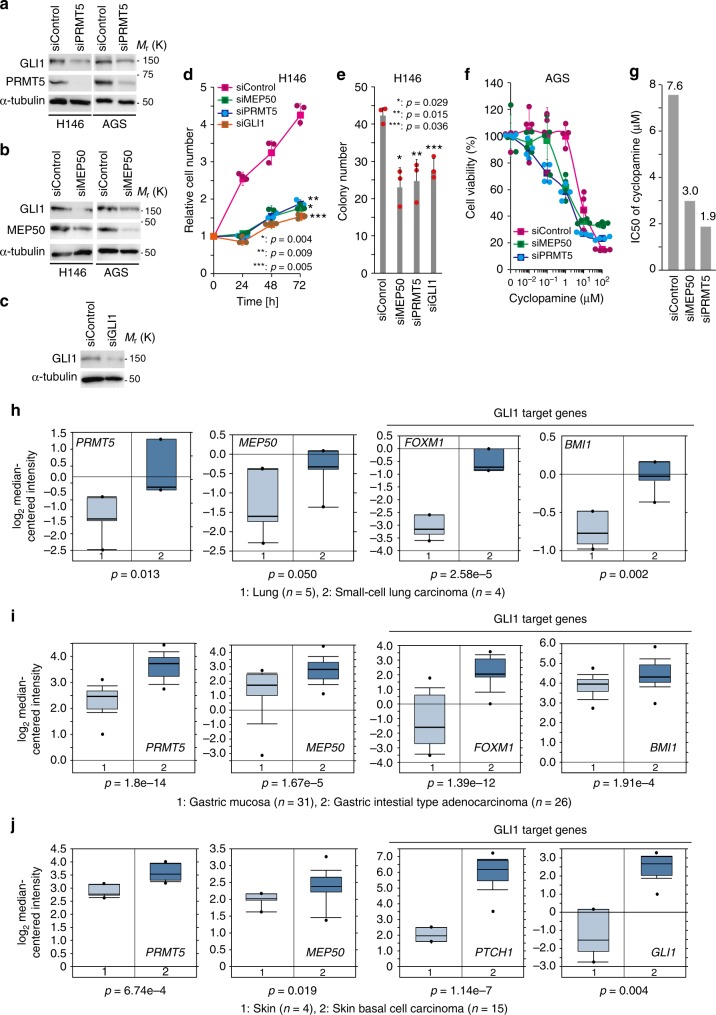
Fig. 6.
PRMT5 and MEP50 expression is upregulated in HH pathway-activated cancers, and PRMT5 inhibition is a potential therapeutic strategy for such cancers. a, b Immunoblot analysis of endogenous GLI1 in H146 and AGS cells stably expressing PRMT5 (a) or MEP50 (b) siRNAs. c Immunoblot analysis of endogenous GLI1 in H146 cells stably expressing GLI1 siRNA. In a–c, siRNAs were stably expressed via recombinant retroviruses. d Growth curves of PRMT5, MEP50, and GLI1-knockdown H146 SCLC cells. Results are shown in the mean ± s.d. of triplicate experiments. e A quantitative colony formation assay was performed by plating cells at a density of 1 × 10⁴ cells in a six-well plate and incubating them for 14 days. Surviving colonies were counted and represented as the mean ± s.d. of three independent wells. In d and e, siMEP50, siPRMT5, or siGLI1 was stably expressed via recombinant retrovirus in H146 cells. f, g IC50 values of cyclopamine in PRMT5-knockdown or MEP50-knockdown AGS cells. siRNAs were stably expressed via recombinant retroviruses. Cell viability (e) is shown as the mean ± s.d. n = 4. IC50 values of cyclopamine are shown in g. h–j Upregulated expression of PRMT5, MEP50, and GLI1 target genes in small cell lung carcinoma (h), gastric adenocarcinoma (i), and skin basal cell carcinoma (j) from the ONCOMINE database (https://www.oncomine.org/). The threshold of data was p ≤ 0.05. Each boxplot shows the log2 maximum, minimum, and median signal intensity of each mRNA from the corresponding expression array. Bold lines on each boxplot define the median value. P-values and sample numbers are indicated in each panel. Unprocessed original scans of blots are shown in Supplementary Fig. 6. Source data of d–f is shown in Supplementary Data 2

