Fig. 2.
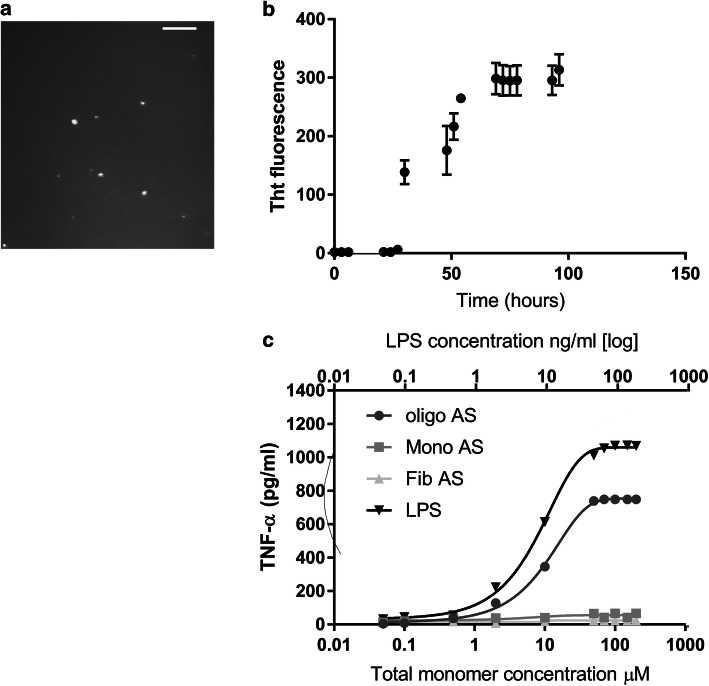
Aggregation of αS and the pro-inflammatory response of microglial cells to different αS aggregates. a ThT single-molecule fluorescence imaging of α-syn aggregates after 24 h of aggregation of 10 µM monomer. Significant increase of aggregates (p < 0.01) is observed. Scale bar represents 5 µm. b Bulk ThT assay of α-syn (10 µM) aggregation when left at 37 °C in a shaking incubator (200 rpm) over a period of 96 h (n = 8 sem). c The pro-inflammatory response, as measured by TNF-α production, of BV2 microglia after a 24-h incubation with αS-only monomers, oligomers, and fibril samples (0.05–200 μM total monomer) compared to LPS (0.05–200 ng/ml) stimulation (n = 5, sem). Monomer or fibrils produce significantly less TNF-α compared to oligomers over all concentrations (monomers p = 0.0029, fibrils p = 0.0018, one way ANOVA with post hoc Tukey)

