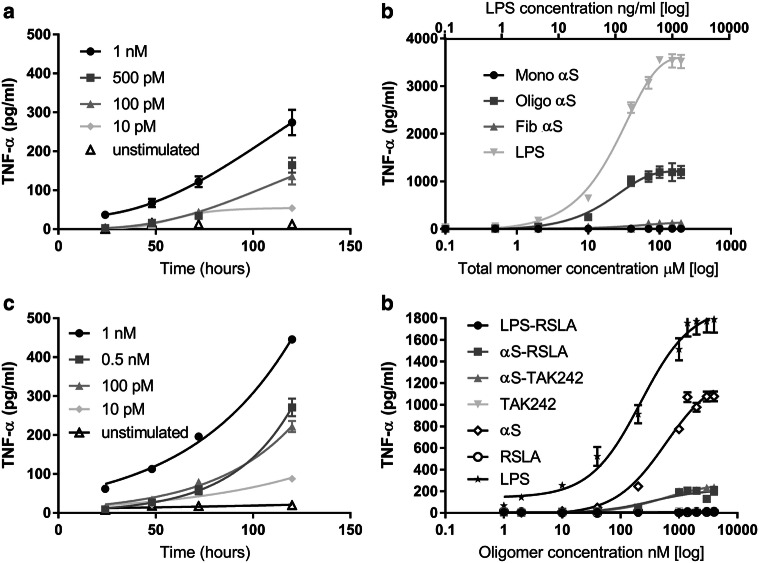
Fig. 4.
Response of BV2 microglial cells and astrocytes to α-syn oligomers and the blocking of TNF-α production by TLR4 antagonists. a Time course of TNF-α production by BV2 cells in response to sustained exposure to αS-oligomers (10 pM–1 nM (n = 3, sem). Buffer was exchanged every 24 h. b The response of astrocytes to αS-monomers, αS-oligomers and αS-Fibrils (0.05–200 μM (total monomer concentrations)) compared to LPS (0.05–200 ng/ml) stimulation stimulation for 24 h (n = 4, sem). A statistically significant increase was observed in response to oligomer vs monomers (p = 0.0041) and in oligomer vs fibrils (p = 0.0078). c Time course of TNF-α production by astrocytes in response to sustained exposure to αS-oligomers (10 pM–1 nM). Buffer was exchanged every 24 h (n = 4, sem). After 72 h a significant increase in response was observed in response to αS-oligomers compared to unstimulated cells (p = 0.009 at 72 h, p = 0.0036 at 120 h). d The response of astrocytes after a 24 h incubation with αS-oligomers only, αS-oligomers and the TLR4 antagonist RSLA and TAK242, LPS with RSLA and RSLA only (n = 3, sem). Both RSLA (p = 0.0165) and TAK-242 (p = 0.0204) show a statistically significant decrease when added with αS-oligomers, compared to αS-oligomers alone. All statistical comparisons among groups were performed using one-way ANOVA with post hoc Tukey test

