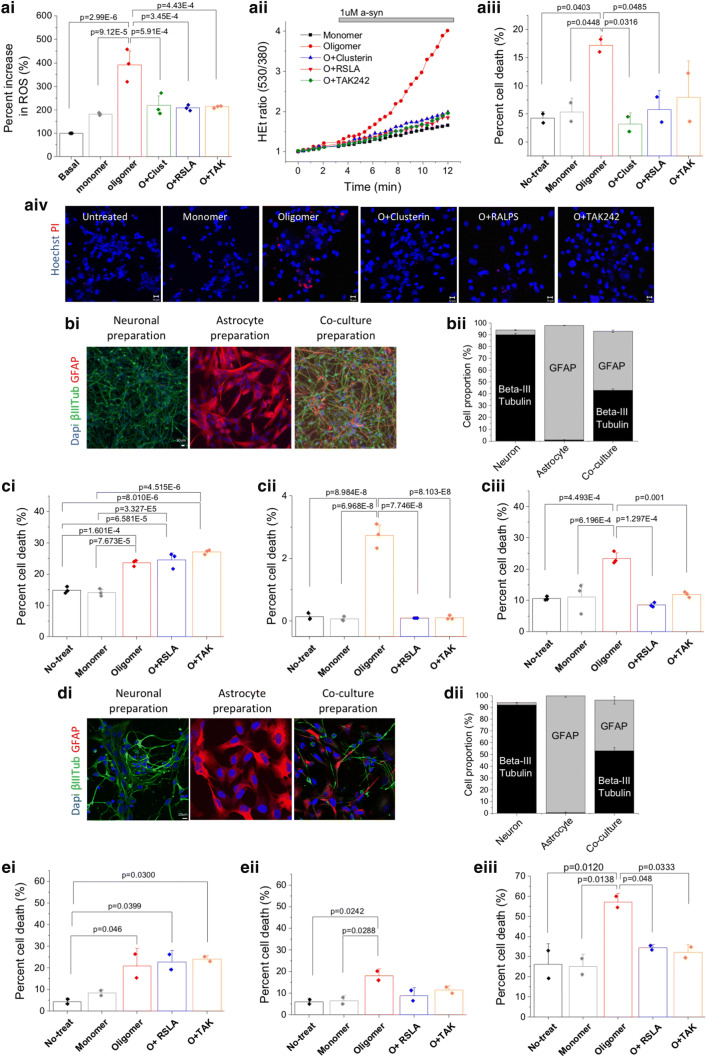
Fig. 6.
Live cell imaging of α-syn oligomer induced cell toxicity, and dependence on TLR4. An oligomeric solution containing 1 μM monomer and approximately 10 nM oligomers were used with or without a range of inhibitors (RSLA, Clusterin, TAK242). ai α-syn oligomer induced ROS was measured in rat cortical neuron and astrocyte co-culture using a ratio of dihydroethydium (Het) fluorescence between its oxidized and non-oxidized forms. 0.1 μg/ml RLSA or 1uM TAK242 reduced overproduction of ROS induced by α -syn oligomer (n = 3, sem). Clusterin, RSLA or TAK242 alone did not produce an increase in ROS (data not shown). aii Representative traces from the ROS measurement show that treatment with TLR4 inhibitors reduced the ratio of Het fluorescence in comparison to α-syn oligomer alone. aiii Cell death assay was performed using Propidium Iodide (PI) under the same conditions but cells were incubated overnight with each inhibitor, Clusterin, RSLA or TAK242 (n = 2, sem). Oligomers induced an increase in cell death whilst all three inhibitors prevented cell death. aiv Representative images from cell death assay. bi Representative images showing rodent neurons and astrocytes bii Quantification of cell type in cultures. ci–iii Cell death was measured in enriched rodent neurons and astrocytes and co-cultures: (i) neurons, (ii) astrocyte, (iii) co-culture preparation. (n = 3, sem). di Representative images showing human neurons and astrocytes. dii Quantification of cell type in cultures. ei–iii Cell death was measured in enriched human neurons and astrocytes and co-culture: (i) neurons, (ii) astrocyte, (iii) co-culture preparation. (n = 2, sem). No-treat: no treatment, Monomer: 1 μM a-syn monomer, Oligomer; 10 nM α-syn oligomer, O + RSLA: 10 nM α-syn oligomer + 0.1ug/ml RSLA, O + TAK: 10 nM α-syn oligomer + 1 μM TAK242. All statistical comparisons among groups were performed using one-way ANOVA, followed by the Tukey’s post hoc test

