Fig. 1.
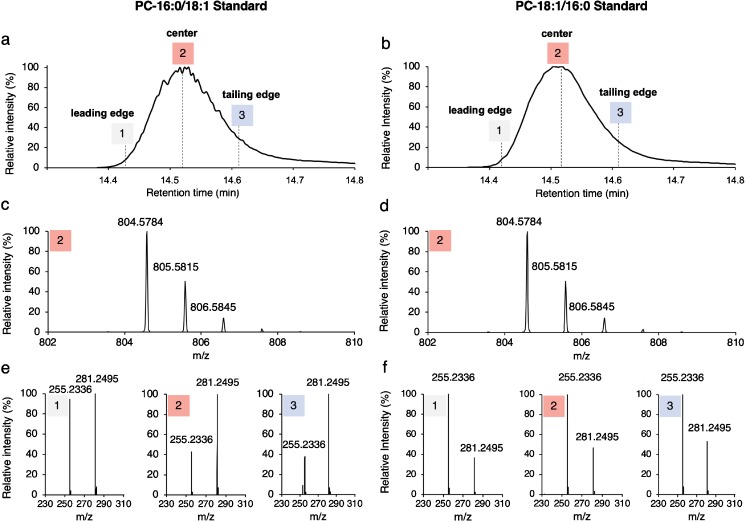
UPLC-MS/MS analysis of PC 16:0–18:1. a, b SIC of the [M + HCOO]− adduct of PC 16:0/18:1 (a) and PC 18:1/16:0 (c). c, d MS1 spectrum recorded at the peak center (2) of the lipid elution profile shown in a and b, respectively. e, f MS/MS spectra of the [M + HCOO]− precursor ion corresponding to the elution times 1, 2, and 3 indicated in a and b. m/z 255.2336 and 281.2495 correspond to the fatty acid anion of 16:0 and 18:1, respectively

