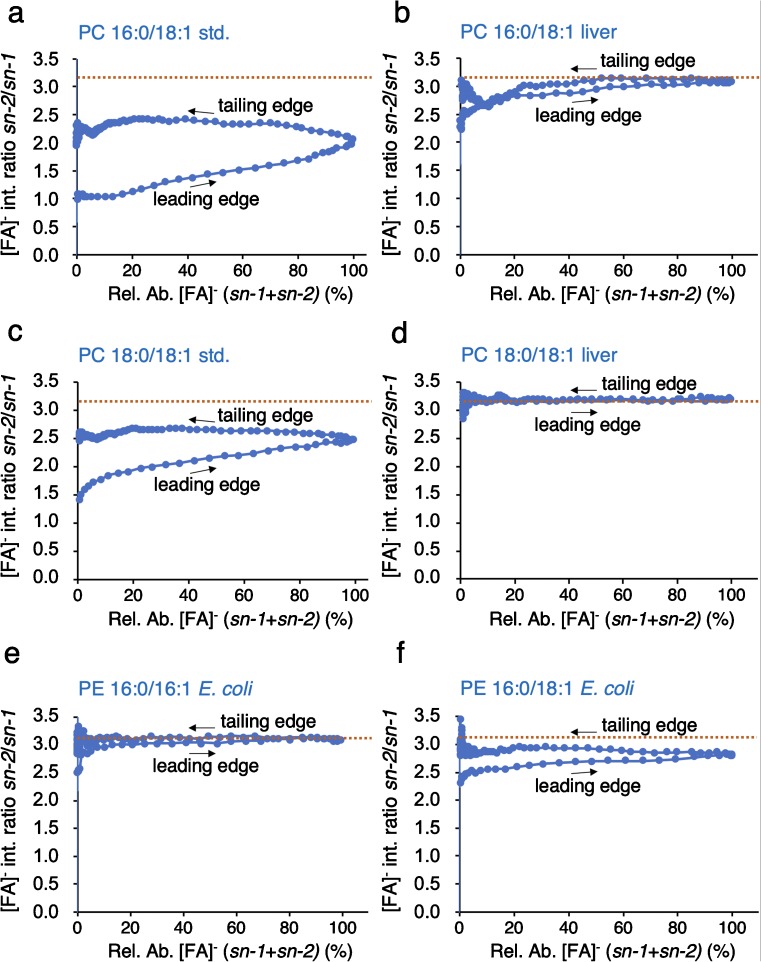
Fig. 3.
Regioisomeric purity plots for four selected PC species. a Standard PC 16:0/18:1, b bovine liver PC 16:0/18:1, c standard PC 18:0/18:1, d bovine liver PC 18:0/18:1, eE. coli PE 16:0/16:1, and fE. coli PE 16:0/18:1. The Rpure values of 3.18 (PC) and 3.19 (PE) apply to all analyzed PCs and PEs, respectively, and are displayed as dashed line (orange). Leading edges and tailing edges of chromatographic peaks are indicated by arrows

