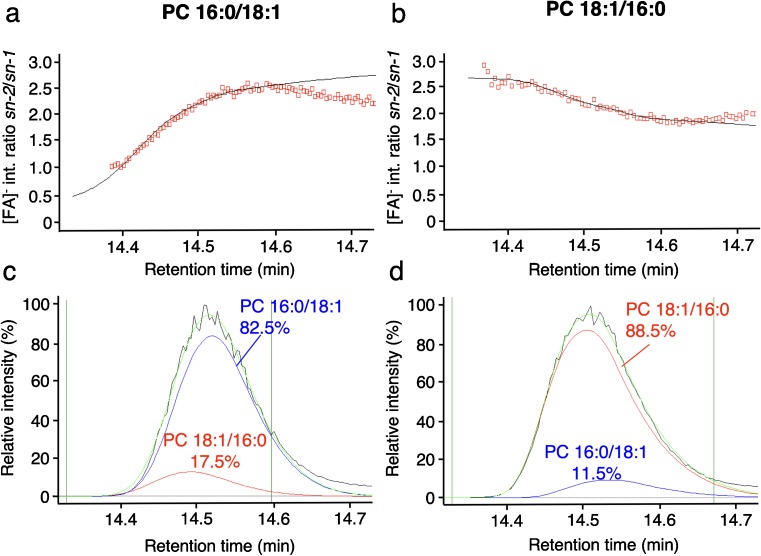
Fig. 4.
Experimental and reconstructed data for regioisomeric composition analysis by UPLC-MS/MS of the two standards PC 16:0/18:1 and PC 18:1/16:0. a, b Experimental fatty acid anion ([FA]−) sn-2/sn-1 intensity ratios (open red squares) and exponential fit (black) for the standard PC 16:0/18:1 (a) and PC 18:1/16:0 (b). The fits in a and b are the basis for the reconstructed elution profiles of the individual regioisomers shown in c and d. c Experimental SIC of m/z 804.576 of the standard PC 16:0/18:1 (black) and three reconstructed elution profiles as follows: pure PC 16:0/18:1 (blue), pure PC 18:1/16:0 (red), and sum of both regioisomers (light green). d Experimental SIC of m/z 804.576 of the standard PC 18:1/16:0 (black) and three reconstructed elution profiles with color code as in c. Upper and lower time limits selected for data reconstruction are indicated by vertical lines (dark green)

